🌍 Public
Fork of Fork of Historical Timeline of Israel
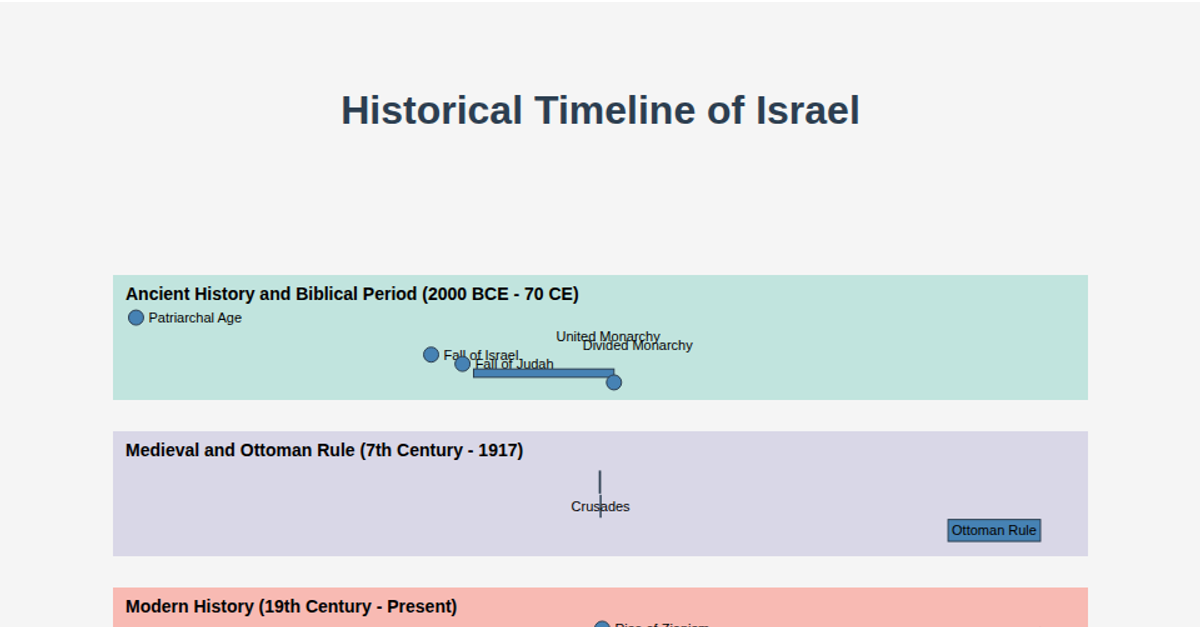
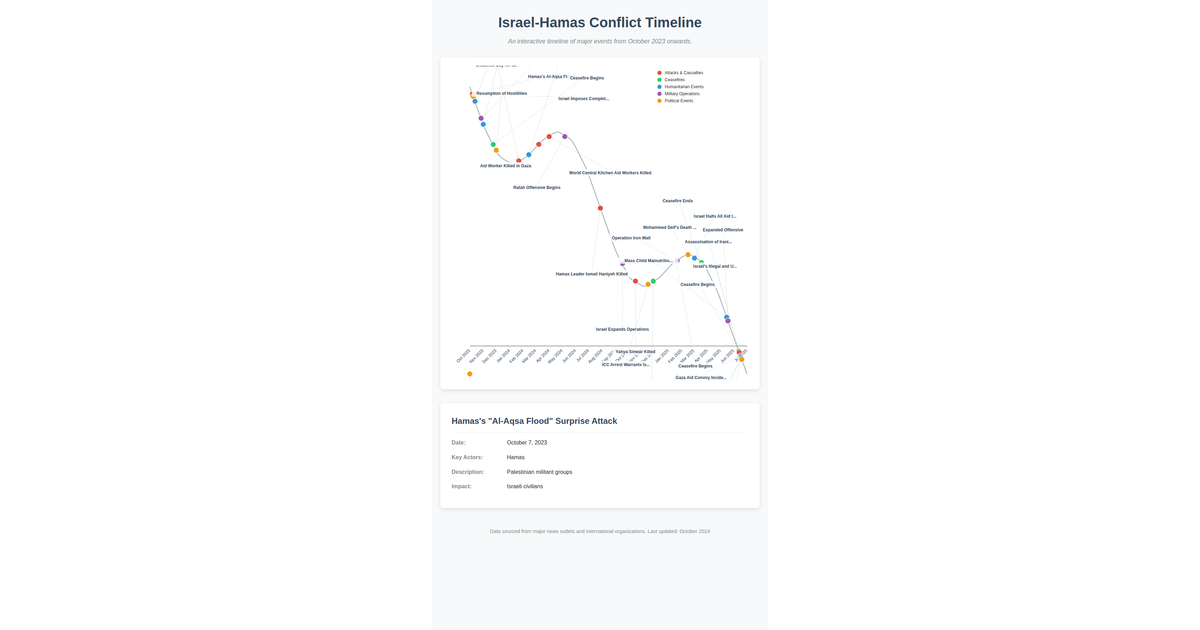
This interactive timeline visualizes the history of Israel, from the ancient patriarchal age to the Hamas-Israel War of 2023, through three clickable color-coded eras. It plots events and date ranges along a continuous scale, using D3.js v7 to render the SVG chart, axis, and event nodes, with tooltips providing descriptions for each historical event.
AI-generated descriptionMIT Licensed




Comments
Sign in to join the discussion.