🌍 Public
sample
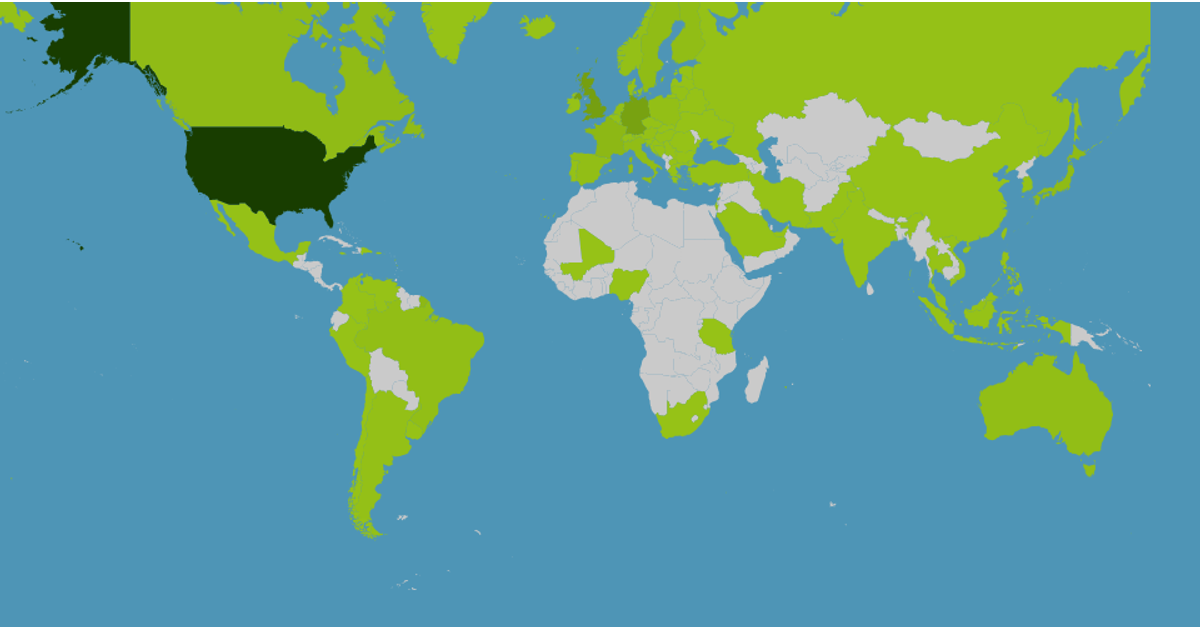
This example shows a choropleth map of global album counts by country, using a green color scale from light to dark to indicate higher totals. Clicking a country opens a modal with placeholder cards for genre, artist, and yearly album statistics, while hovering displays a tooltip with the country name and album count. The map is rendered with D3 v5’s `geoMercator` projection and `geoPath`, with data loaded from `world-atlas` TopoJSON and a local `data_map.json`. Zoom and pan are enabled via D3’s `zoom` behavior, and Bootstrap handles the modal interaction.
AI-generated description⚠⚠⚠ Si jamais rien ne s'affiche, réactualisez avec ctrl + shift + R ⚠⚠⚠
MIT Licensed





Comments
Sign in to join the discussion.