🌍 Public
Fork of HTML Starter
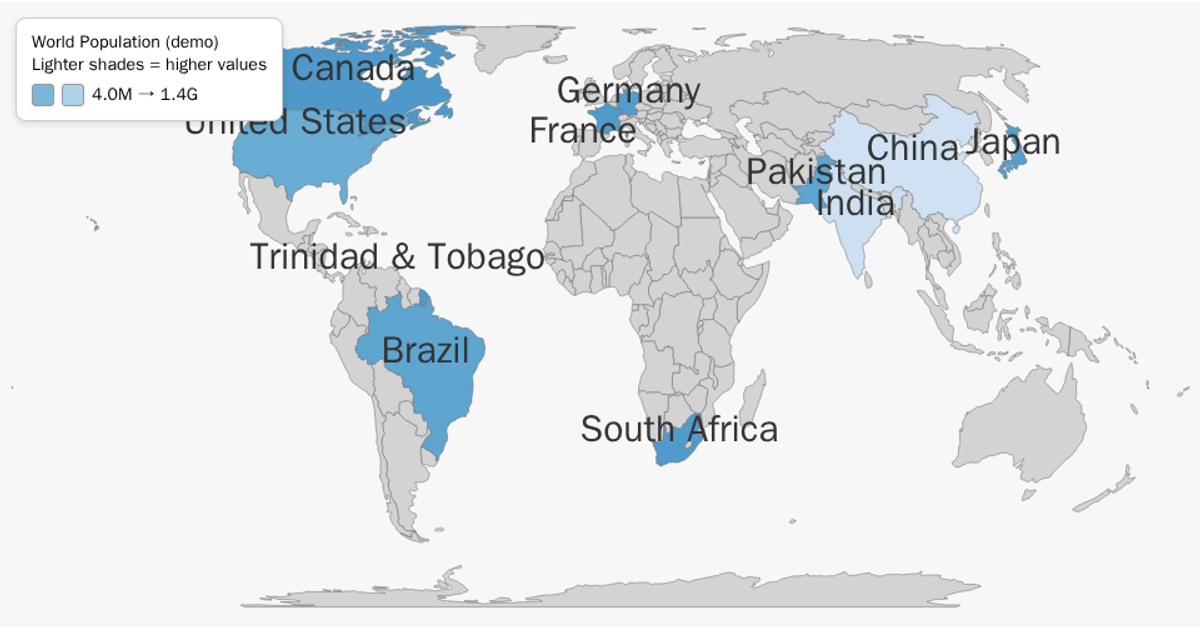
This interactive SVG world map highlights five countries colored by population size, with India and China appearing darkest on a blue sequential scale. The visualization loads world geometry from the world-atlas TopoJSON dataset, then uses `topojson.feature` to extract country boundaries and `d3.geoPath` with a Natural Earth projection to render them. The D3 v7 code joins the TopoJSON features with the CSV-derived population data by country name, applying a tooltip on mousemove to display exact population figures. Countries lacking data render as gray.
AI-generated descriptionMIT Licensed



Comments
Sign in to join the discussion.