🌍 Public
Fork of Simple Scatter Plot
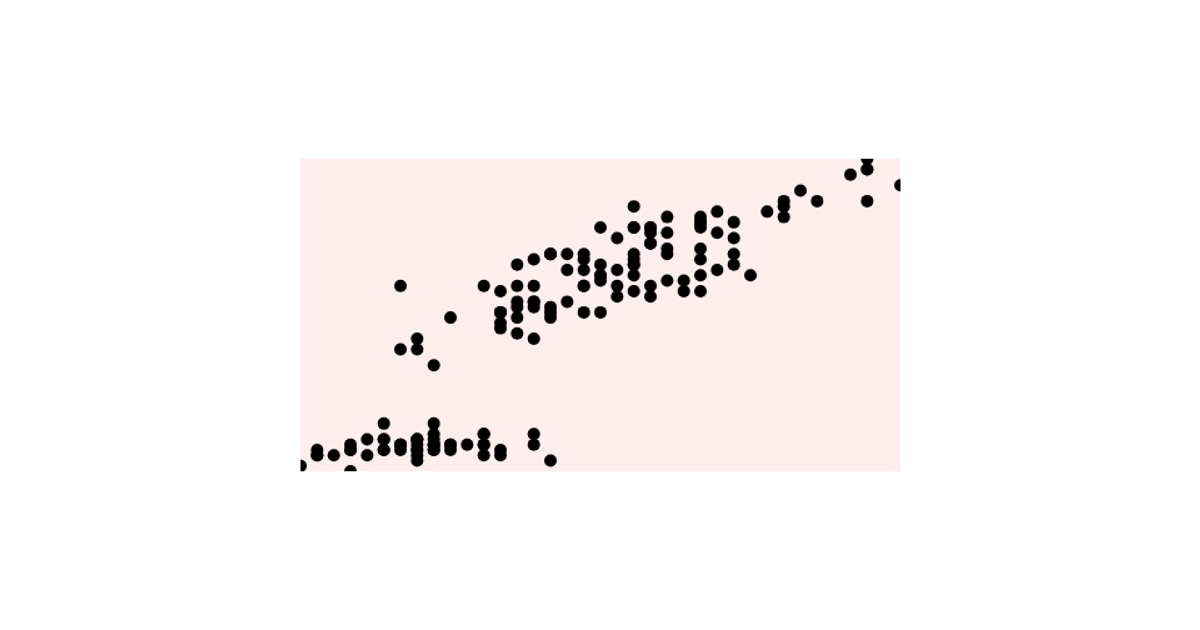
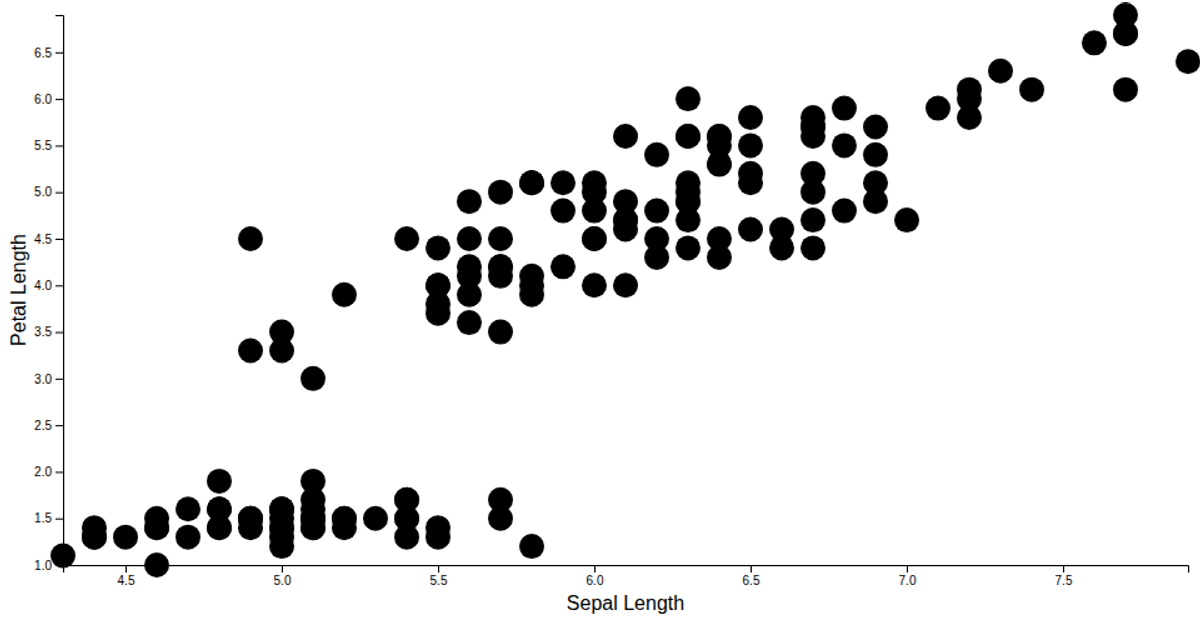
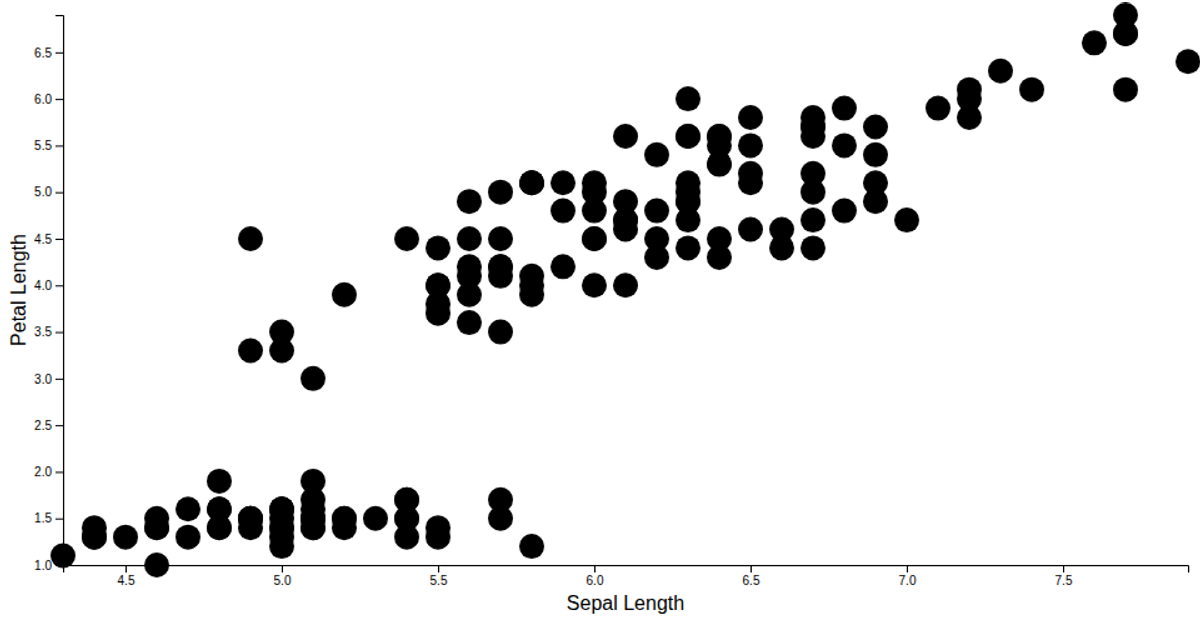
This fork of the classic Iris scatter plot visualizes sepal and petal measurements from the built-in iris.csv dataset, with points colored by species. It uses D3’s `csv` loader to parse the data and logs the parsed rows to the console. The rendering logic is delegated to an imported `viz` module, which builds the scatter plot from the loaded data. The example demonstrates a modular structure where data loading and visualization are separated.
AI-generated descriptionMIT Licensed





Comments
Sign in to join the discussion.