🌍 Public
Line Plots and Area bois
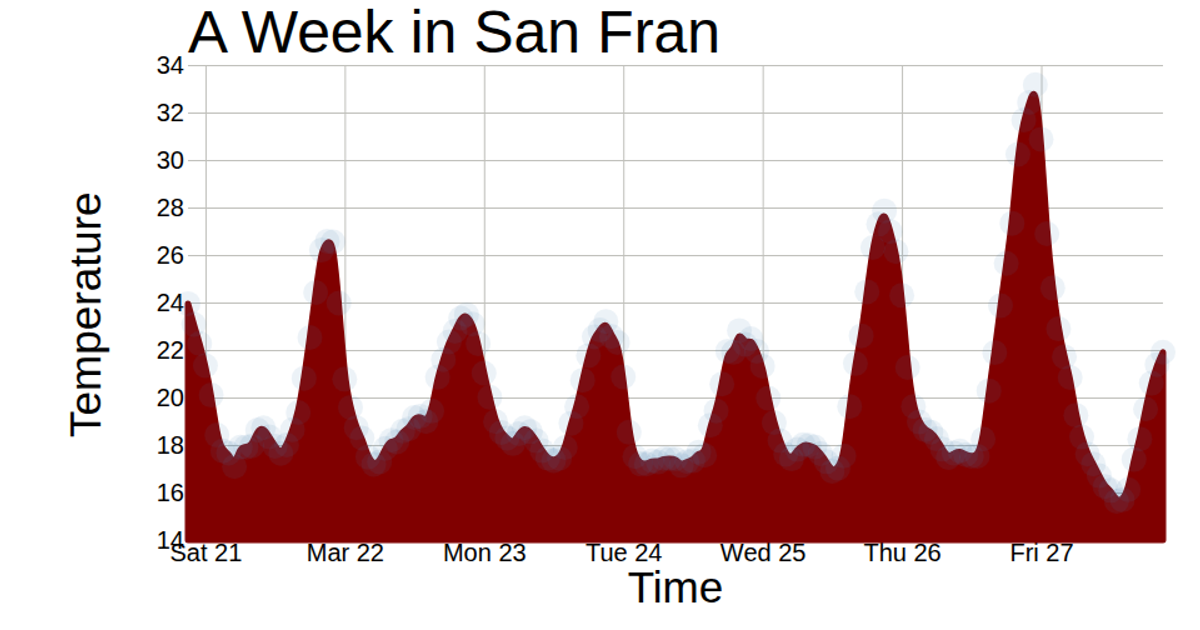
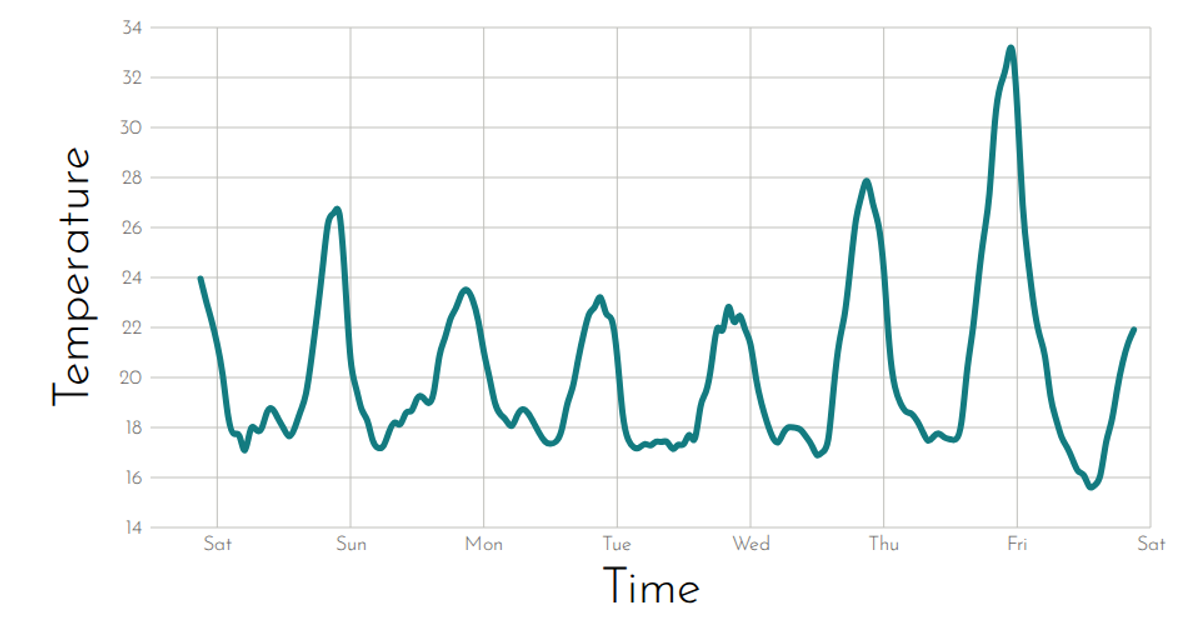
This example visualizes a week of hourly temperature readings in San Francisco using a line plot with an animated scatter of circles. The chart displays temperature trends over time, with axes labeled for time and temperature, and a title indicating the data period. It is built with React and D3 v5, using `d3.scaleTime`, `d3.scaleLinear`, `d3.axisLeft`, and `d3.axisBottom` to render axes, while circles are added via SVG transitions. Data is loaded from a CSV file using `d3.csv`.
AI-generated descriptionReact Starter code.
MIT Licensed



Comments
Sign in to join the discussion.