Fork of Fork of Vega-Lite API Template
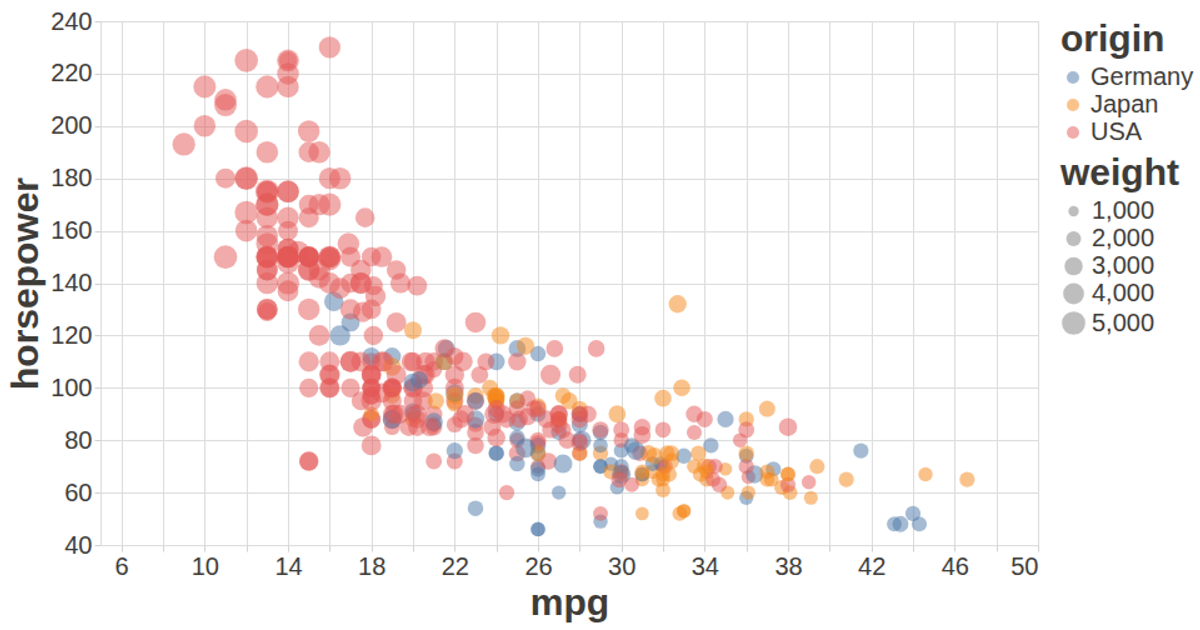
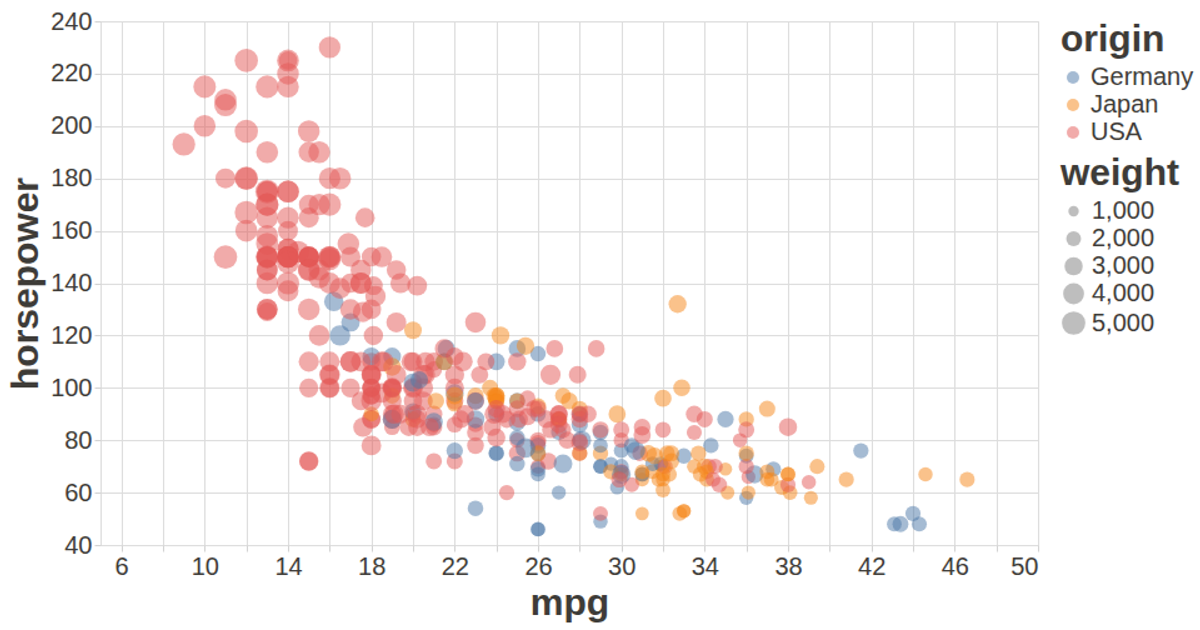
This scatter plot visualizes the relationship between automobile characteristics, with miles per gallon on the x-axis, horsepower on the y-axis, origin indicated by color, and weight mapped to point size. The chart uses tooltips to display vehicle names and detailed specifications. The visualization is built using the Vega-Lite API in conjunction with D3.js for data loading and Vega Tooltip for interactive hover effects. Data comes from the UCI Machine Learning Repository's auto-mpg dataset, converted from CSV format. The chart adapts to window resizing via a ResizeObserver and features customized styling for improved readability.
AI-generated descriptionAutomobile Data Visualization
This project visualizes the relationship between automobile characteristics using Vega-Lite. The scatter plot shows:
- X-axis: Miles per gallon (MPG)
- Y-axis: Horsepower
- Color: Origin of the vehicle
- Size: Weight of the vehicle
- Tooltip: Vehicle name and additional details
Features
- Responsive design that adapts to window resizing
- Interactive tooltips with vehicle details
- Clean, modern styling with improved readability
- Optimized data loading and rendering
Technologies
- Vega-Lite for visualization grammar
- D3.js for data loading
- Vega Tooltip for interactive tooltips
Data Source
The dataset is sourced from the UCI Machine Learning Repository and contains specifications for various automobiles.




Comments
Sign in to join the discussion.