🌍 Public
World Map Q6
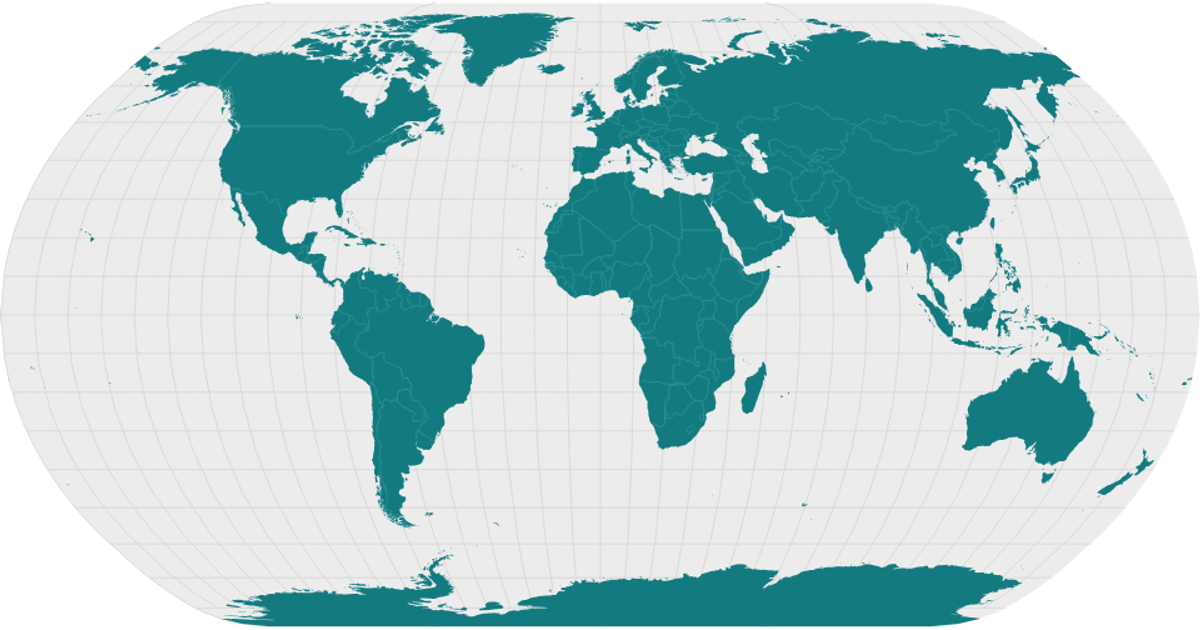
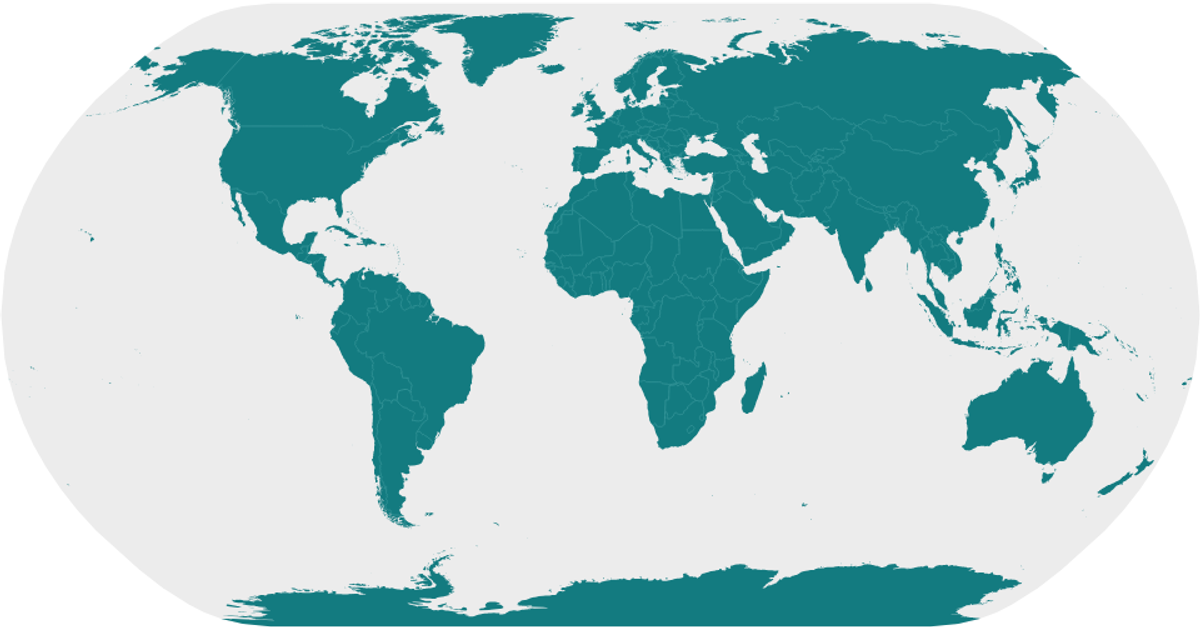
This example renders a world map using D3’s `geoNaturalEarth1` projection and `geoPath` to draw land, country boundaries, graticules, and a sphere outline from World Atlas TopoJSON data. Countries are shaded teal with lighter interior borders, while graticules appear as subtle gray lines. The React component fetches the TopoJSON, converts it to GeoJSON via `topojson.feature` and `topojson.mesh`, and outputs SVG paths. The visualization emphasizes polished styling over interactive behavior.
AI-generated descriptionA world map showing country boundaries from World Atlas TopoJSON, polished for visual style, including graticules.
MIT Licensed


Comments
Sign in to join the discussion.