🌍 Public
Untitled
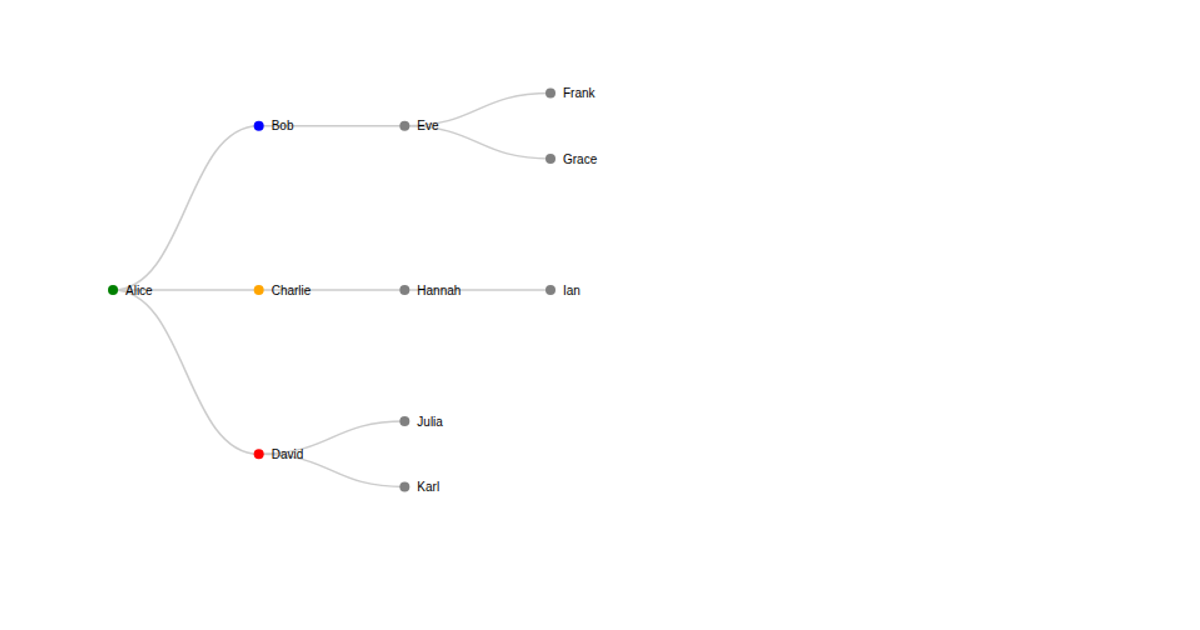
This example shows an organizational chart displaying a company hierarchy, with nodes for employees like Mike, Jim, Alice, Bob, and Carol connected by manager relationships. It uses Google Charts’ OrgChart package, loading the visualization library from the Google CDN and drawing the chart into a div element. The data is defined via a `google.visualization.DataTable` with string columns for name, manager, and tooltip, and custom HTML formatting is enabled through the `allowHtml` option to style node labels and tooltips.
AI-generated descriptionA bare minimum HTML page.
See also React Starter.
MIT Licensed




Comments
Sign in to join the discussion.