🌍 Public
A7Q2
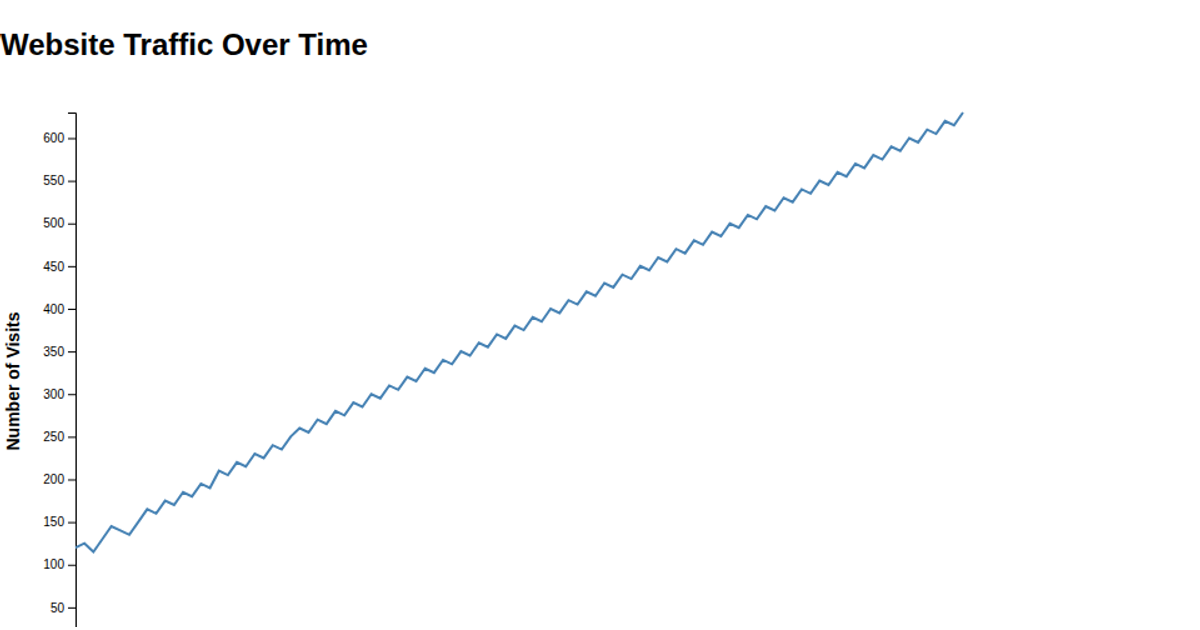
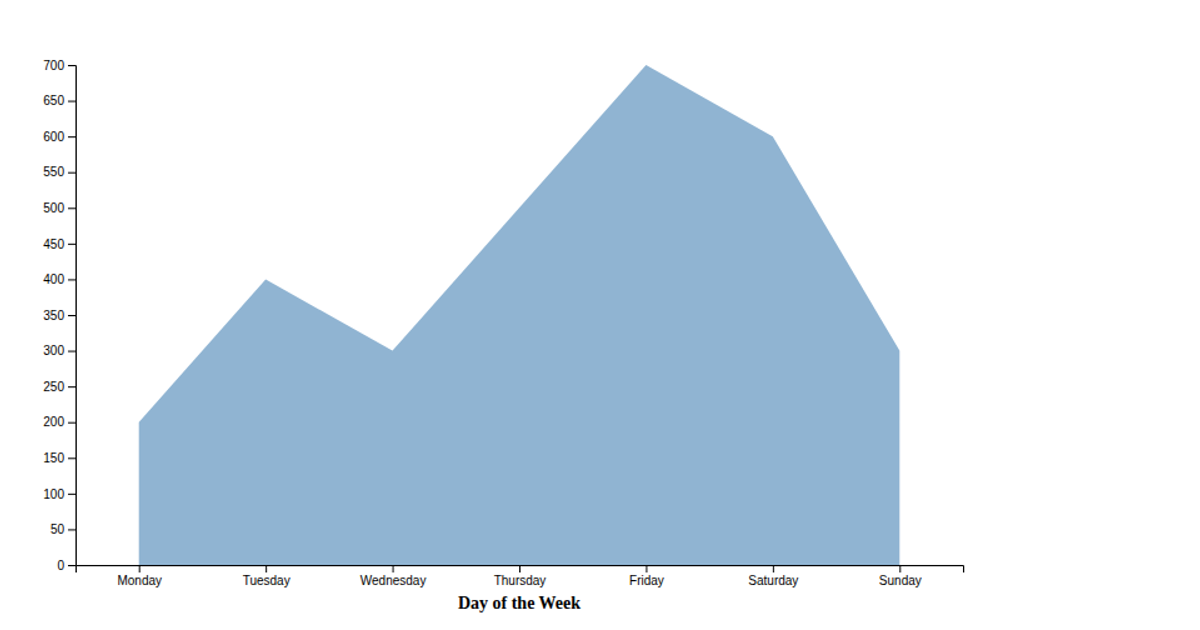
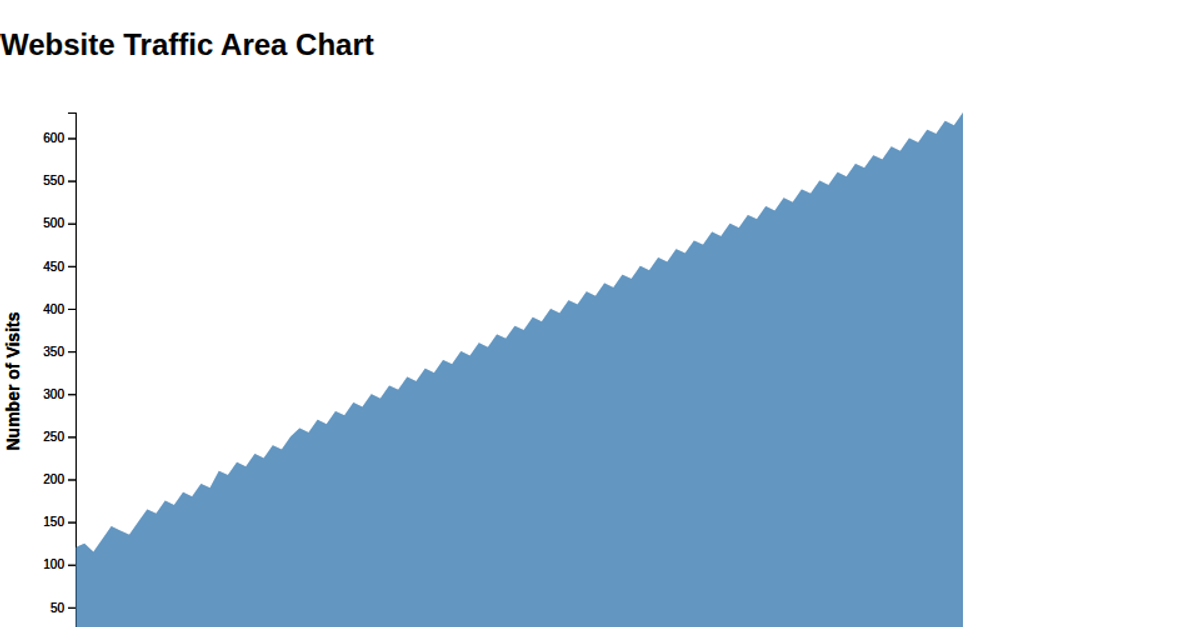
This example shows website visitor counts across a week, with line chart points for each day from 230 to 890 visitors. The visualization uses Chart.js within an HTML canvas element, setting the line’s fill property to false while applying a curved tension of 0.4. The dataset is hardcoded in the script, and the y-axis begins at zero. Chart.js renders the chart on a 400-by-400 pixel canvas.
AI-generated descriptionMIT Licensed





Comments
Sign in to join the discussion.