🌍 Public
Fork of Stylized Line React
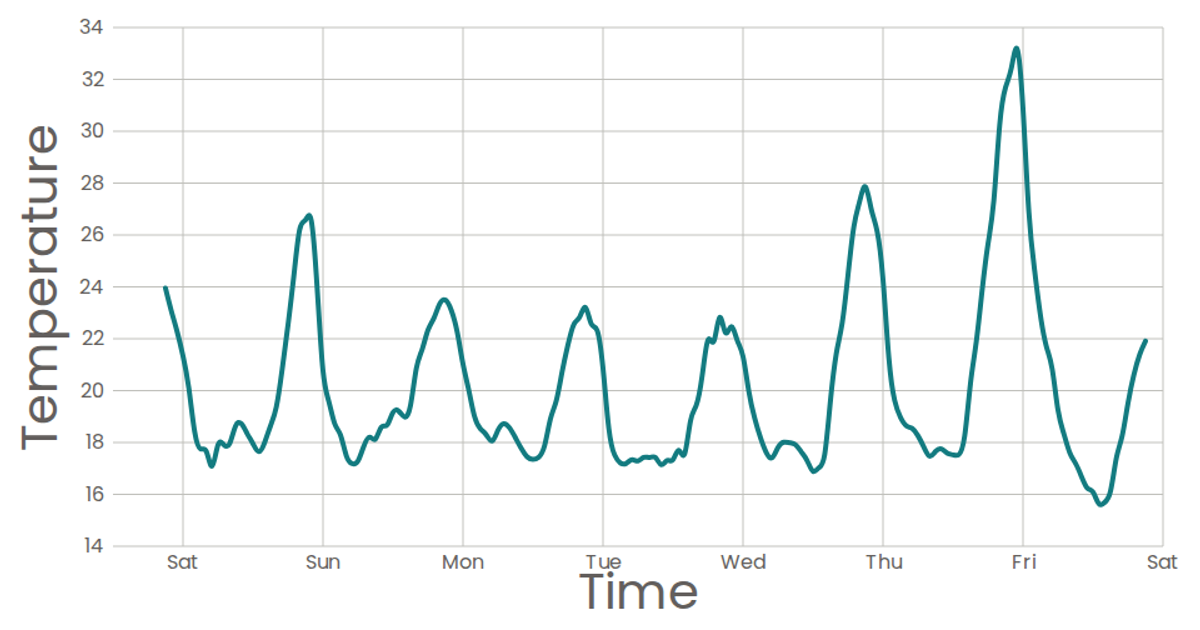
This visualization presents a time-series bar chart of reported migrant deaths and missing persons, aggregated into monthly bins from a CSV dataset. The chart displays the total count per month along a continuous time axis, with bars whose heights correspond to the summed values. The implementation uses React components, D3 v7 utilities such as `scaleTime`, `scaleLinear`, `histogram` for binning, and `timeMonths` for thresholds, rendering as SVG with custom axes and marks. The data is loaded via `d3.csv` from a remote gist, and styling uses the Poppins font.
AI-generated descriptionA bare minimum HTML page demonstrating use of CSS and JavaScript.
See also React Starter. css named colors
scatter plot test
MIT Licensed



Comments
Sign in to join the discussion.