🌍 Public
animation cirlce of Reusable for scatter plot animation
FFrancisco Ibelles
Last edited Jun 20, 2023
Created on Jun 20, 2023
Forked from Fork of Reusable for scatter plot animation
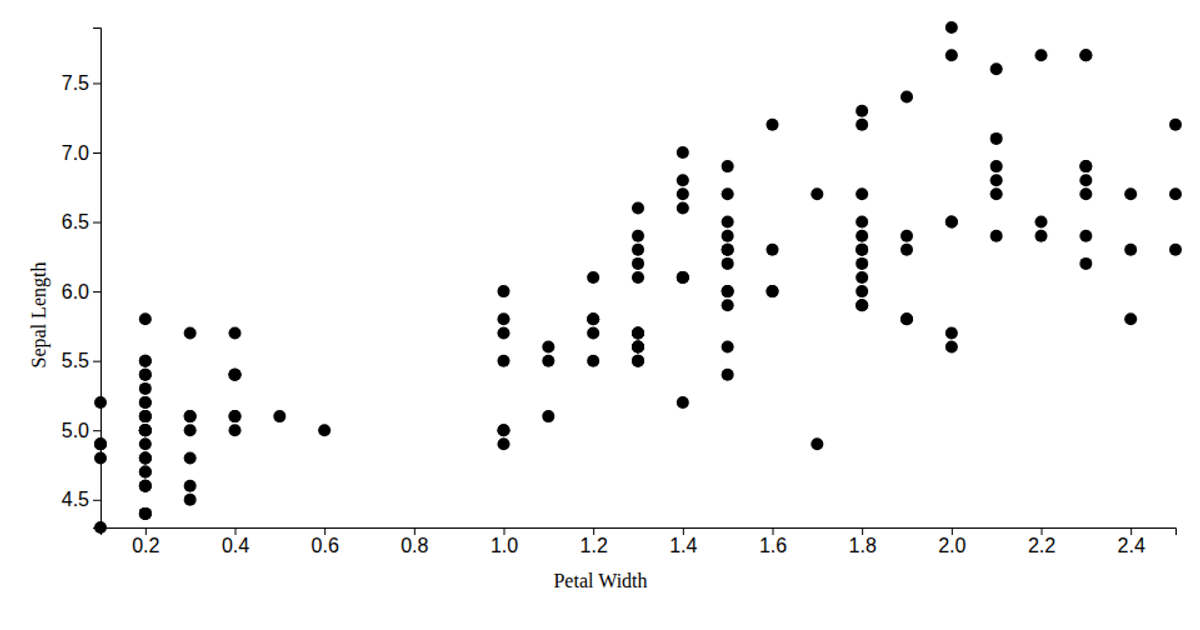
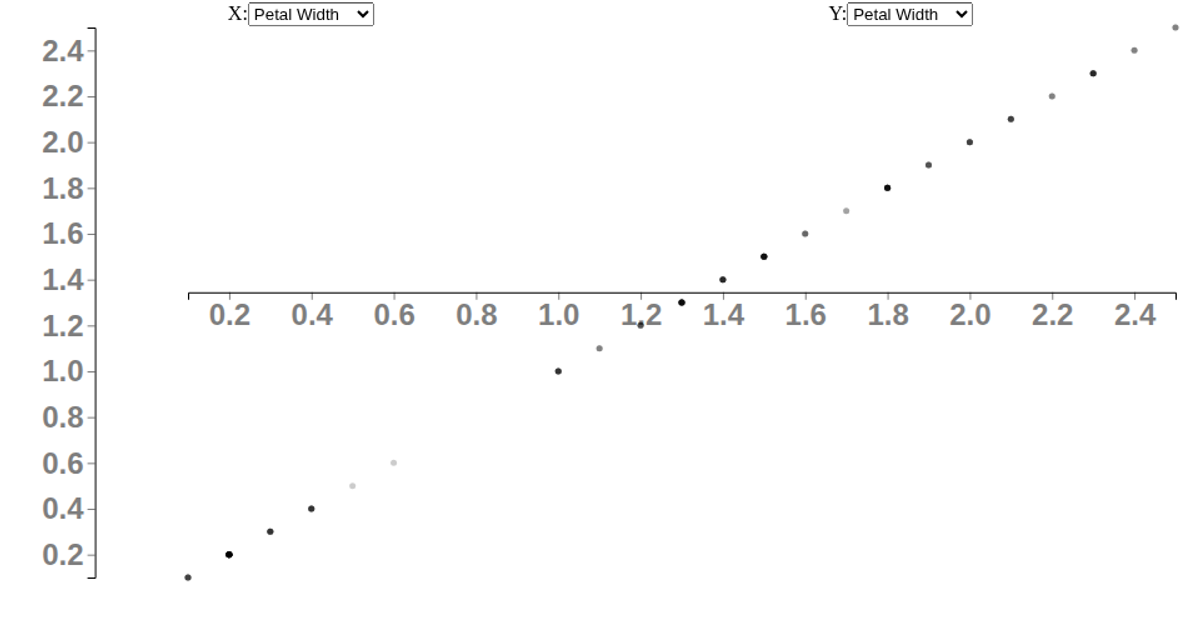
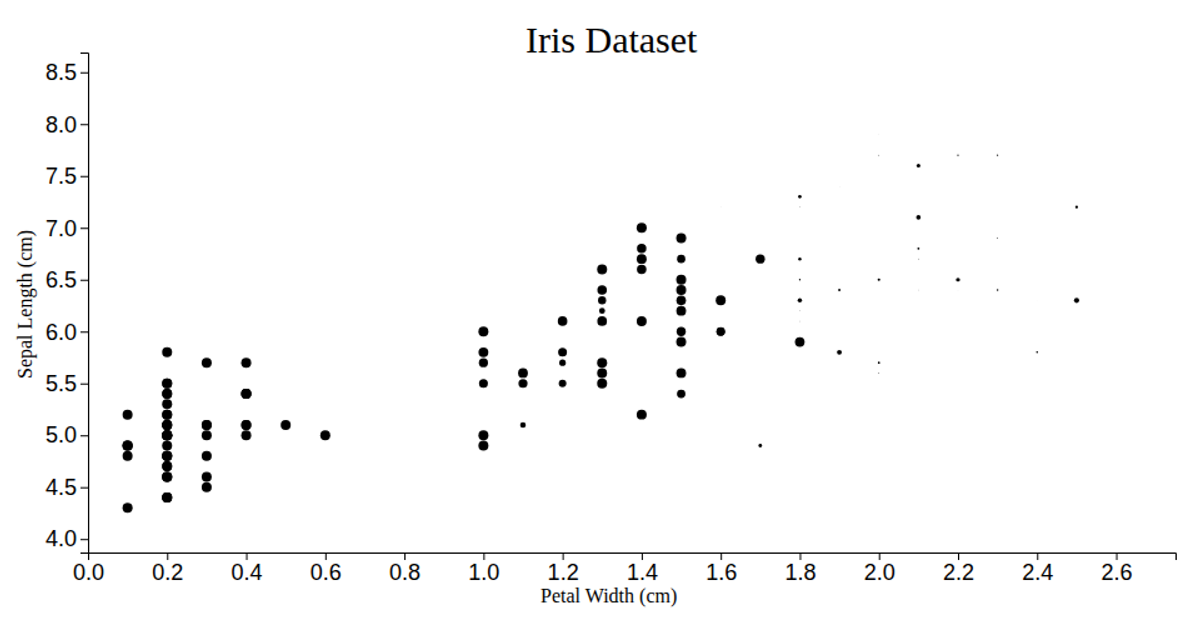
This example demonstrates a reusable scatter plot that cycles through the Iris dataset, rotating between the four measurement columns for the x- and y-axes while also shifting the point color through a sequence. The animation, built with D3.js v7, uses the `transition` API to smoothly interpolate the positions and colors of the SVG circles over 3-second intervals. The `scatterPlot` custom component separates chart configuration from rendering, and the code loads data from a CSV file hosted in a GitHub Gist, with axes and circles re-rendered on each update.
AI-generated descriptionA reusable scatter plot inspired by Towards Reusable Charts.
Shows the Iris Dataset.
MIT Licensed





Comments
Sign in to join the discussion.