🌍 Public
Bar chart with D3.js
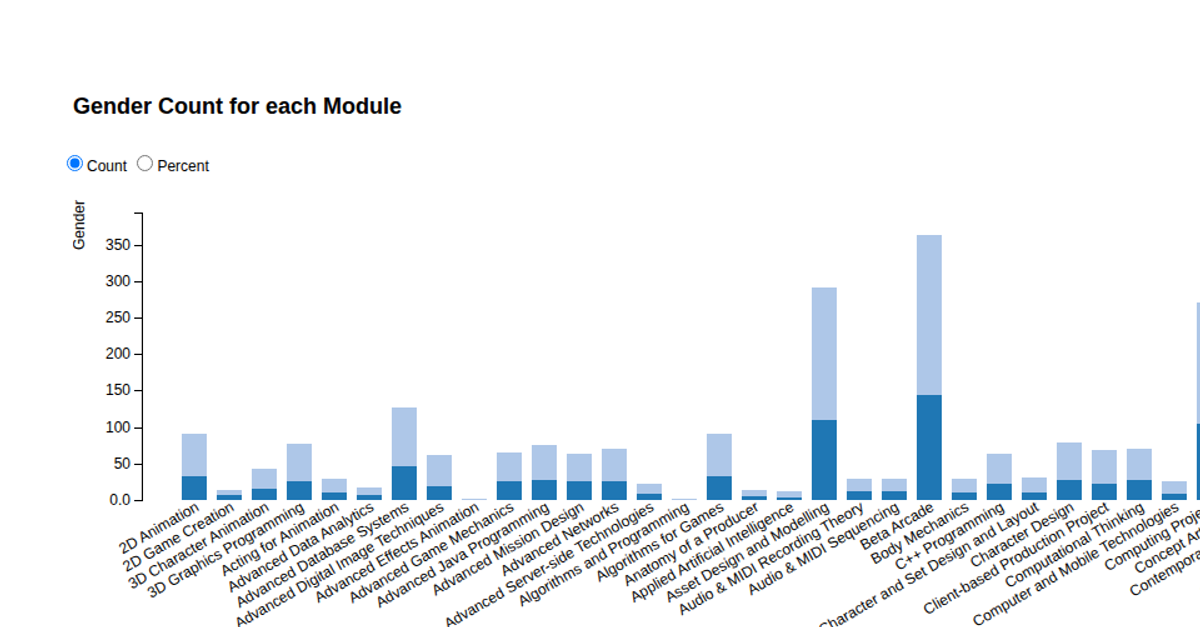
This bar chart visualizes genderwise comparison of sharks, showing the frequency distribution of male and female observations from a CSV dataset. The chart uses SVG rendering with D3.js v5, employing `d3.scaleLinear` for the y-axis, `d3.scaleBand` for categorical x-axis positioning, and `d3.axisLeft`/`d3.axisBottom` for gridlines and ticks. Interactive hover effects trigger `transition` animations, highlighting divergence percentages via appended text and a dashed limit line.
AI-generated descriptionMIT Licensed




Comments
Sign in to join the discussion.