🌍 Public
ICE-8 1A Ankit goud Poodhari
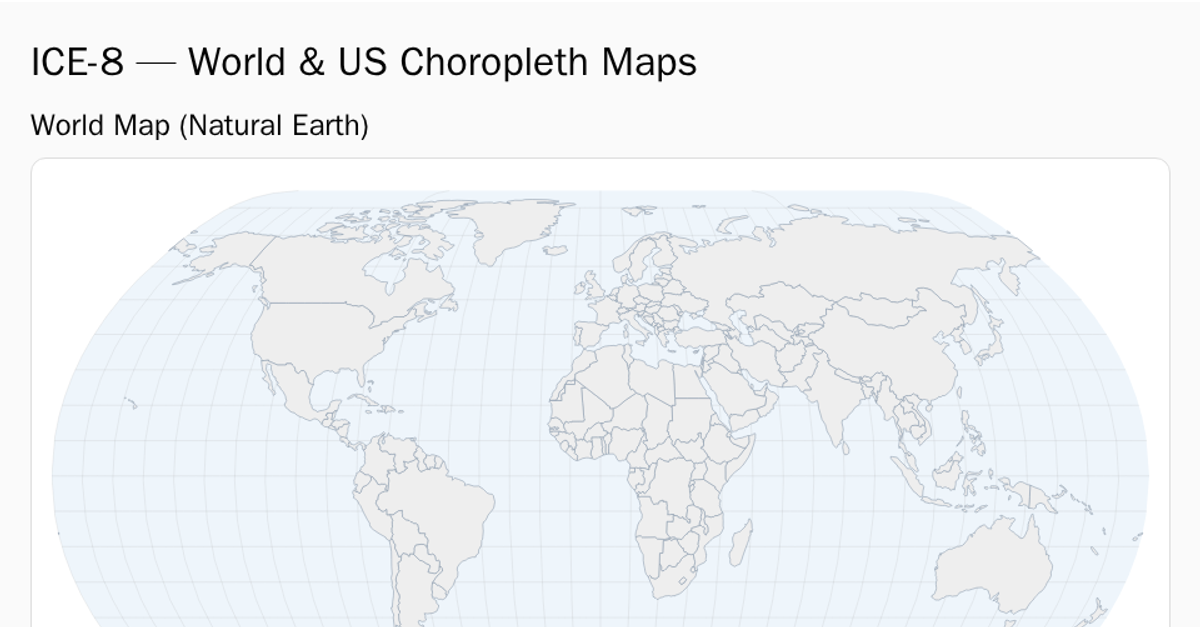
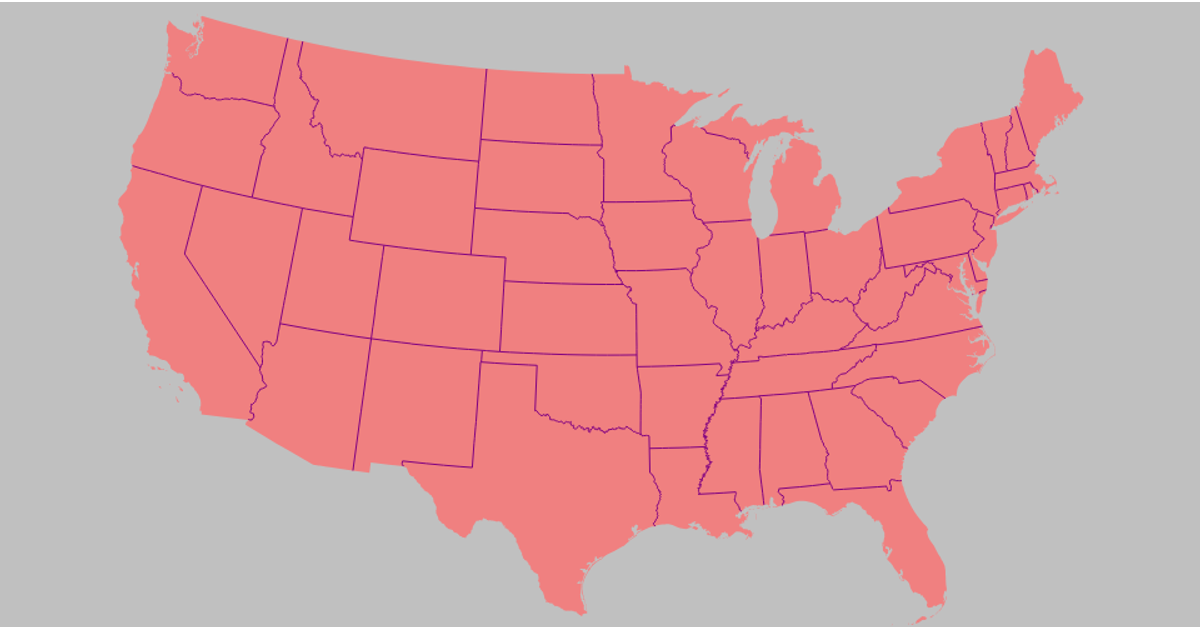
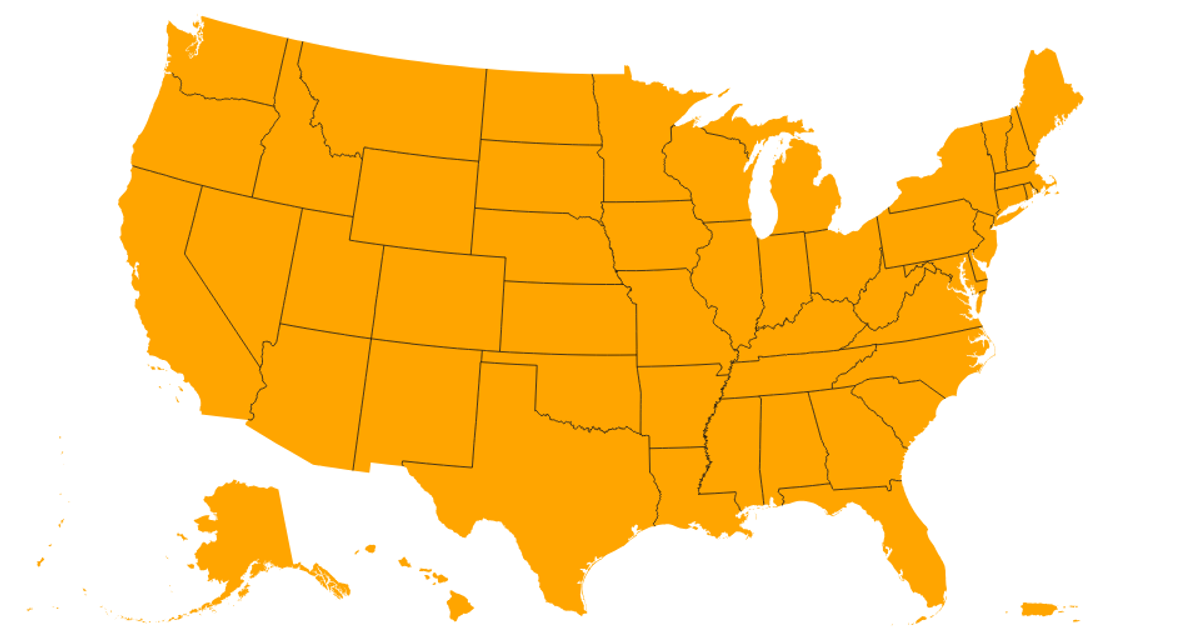
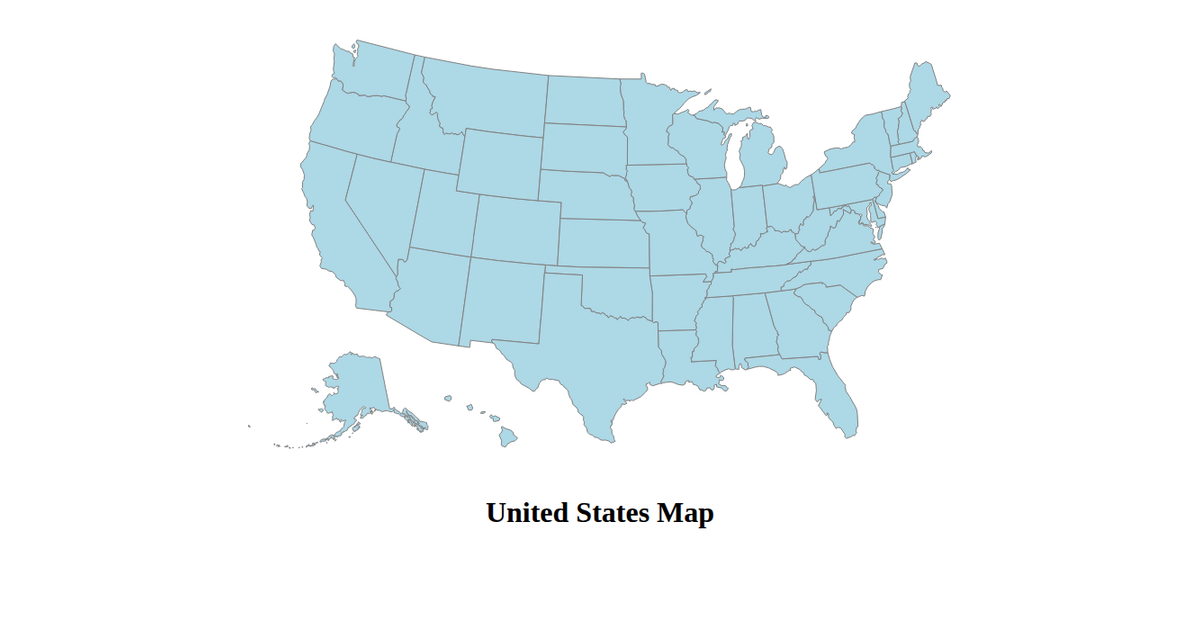
This D3.js visualization presents two interactive choropleth maps. The global map displays internet usage as a percentage of the population across countries, using the `d3.geoMercator()` projection and a blue sequential color scale. The United States map depicts renewable energy share per state, employing the `d3.geoAlbersUsa()` projection with `d3.geoPath()` for rendering. Both maps load TopoJSON data from external sources using `d3.json()`, processing it with the `topojson-client` library to generate SVG paths with tooltips.
AI-generated descriptionMIT Licensed



Comments
Sign in to join the discussion.