🌍 Public
Act6_q1
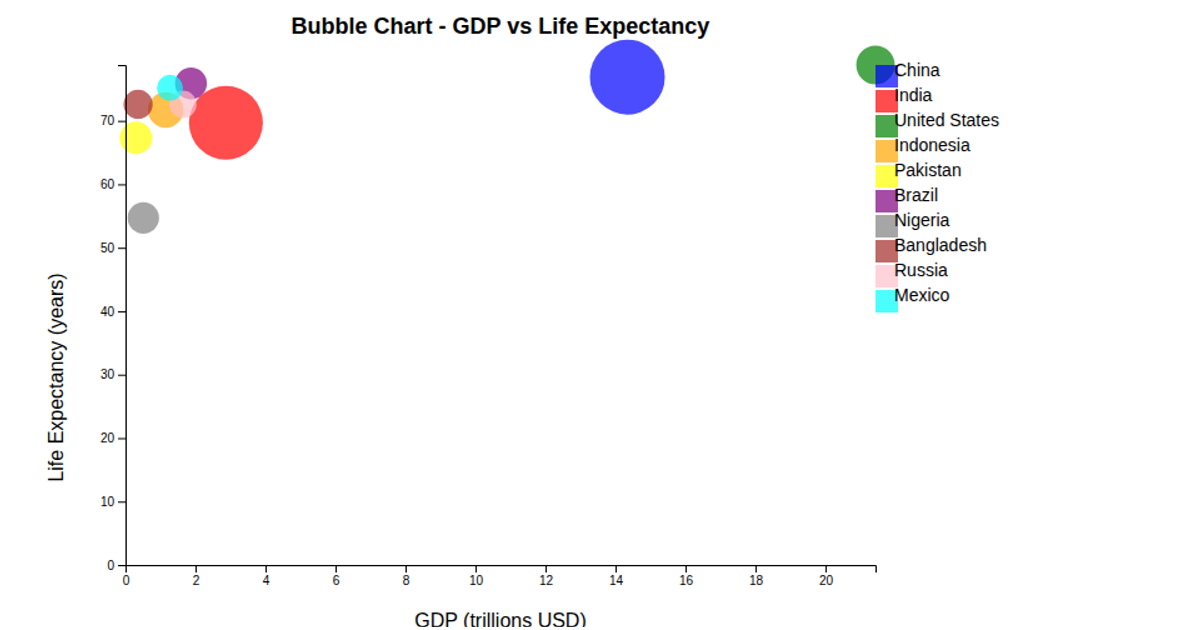
This bubble chart plots GDP against life expectancy for five countries, with bubble size representing population. The visualization uses D3.js v7 with inline SVG rendering. It applies `d3.scaleLinear` for both axes and `d3.scaleSqrt` for bubble sizing, while `d3.axisBottom` and `d3.axisLeft` generate tick marks. Country labels appear next to each bubble, and the data comes from a simple hardcoded array rather than an external file.
AI-generated descriptionAn example showing the capabilities of VizHub:
- Loads D3 via UNPKG.
- Demonstrates use of
importfrom"d3". - Demonstrates use of
importfrom local ES6 modules.
MIT Licensed




Comments
Sign in to join the discussion.