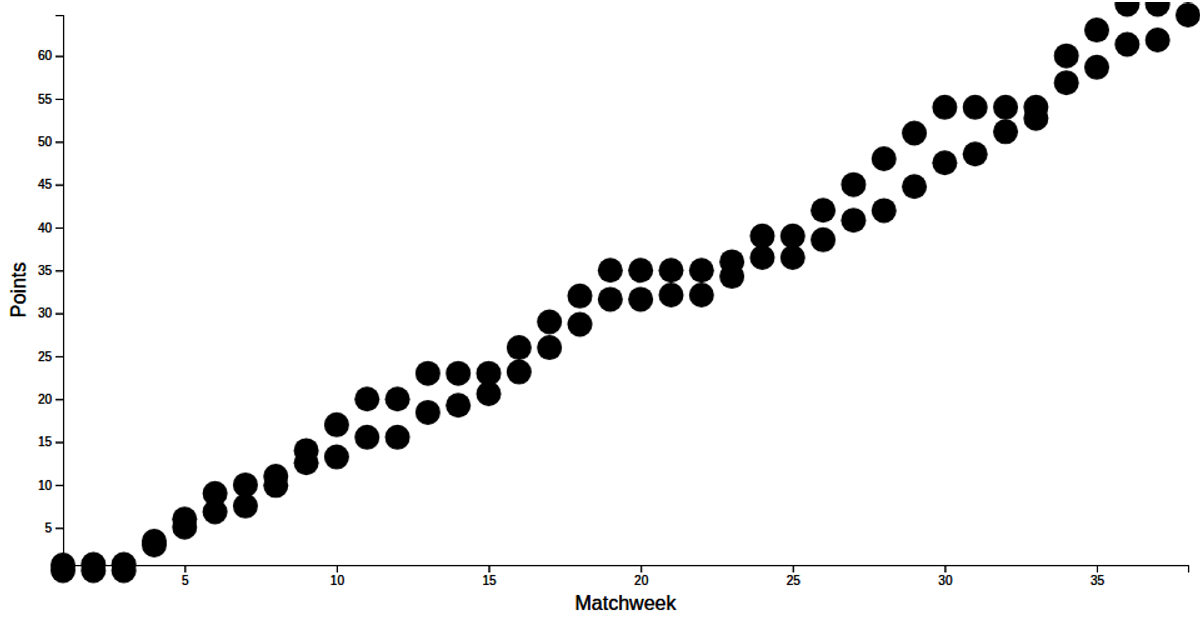
Scatter Plot PL xG Data with both xP and Points with menu
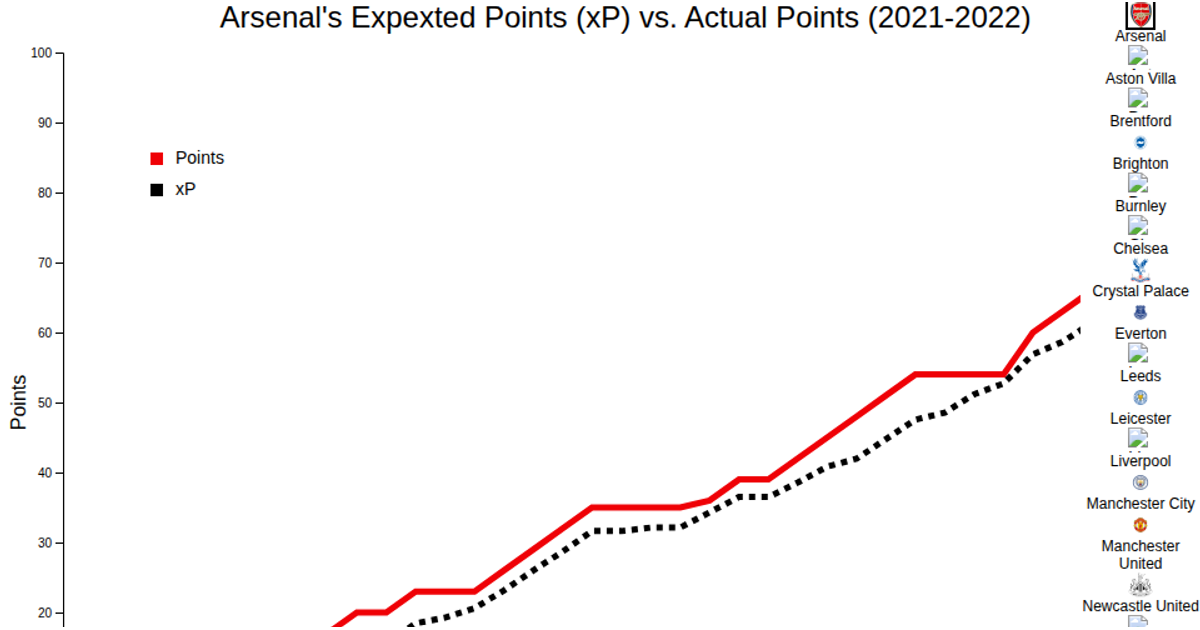
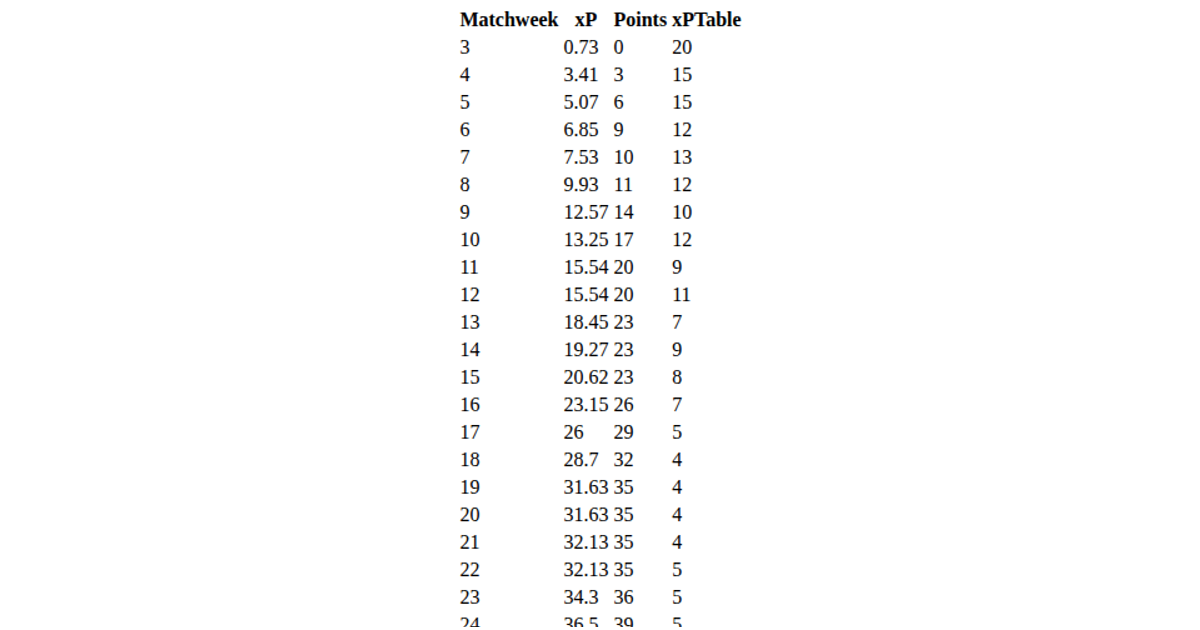
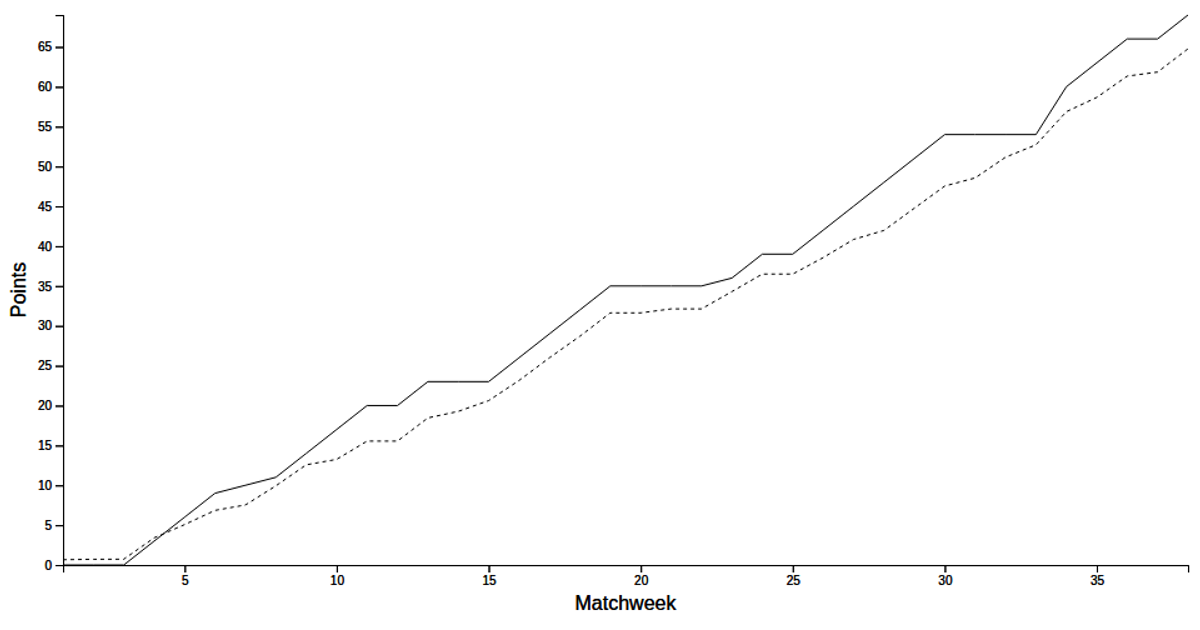
This interactive scatter plot visualizes Premier League data for a selected team, comparing actual points against expected points (xP) across matchweeks. A dropdown menu lets users choose among teams, updating two overlaid lines: a solid red line for actual points and a dashed black line for xP. Built with D3 v7, the visualization fetches CSV data from GitHub Gists, uses scaleLinear for axes, and implements a custom dropdown with scroll functionality. The menu, axes, and scatter plot are modularized into separate JavaScript functions, with styled red accents matching team colors.
AI-generated descriptionA scatter plot of the PL xG data with axes and a button.
Help from: https://d3-graph-gallery.com/graph/line_select.html and https://www.w3schools.com/howto/howto_js_dropdown.asp and https://www.freecodecamp.org/news/how-to-build-a-dropdown-menu-with-javascript/ and https://alvarotrigo.com/blog/drop-down-menu-javascript/ and https://www.solodev.com/blog/web-design/how-to-add-scroll-functionality-to-your-dropdowns.stml and https://www.youtube.com/watch?v=POeKjbV6TMI and https://www.w3schools.com/js/js_events.asp




Comments
Sign in to join the discussion.