🌍 Public
ICE8_ Map
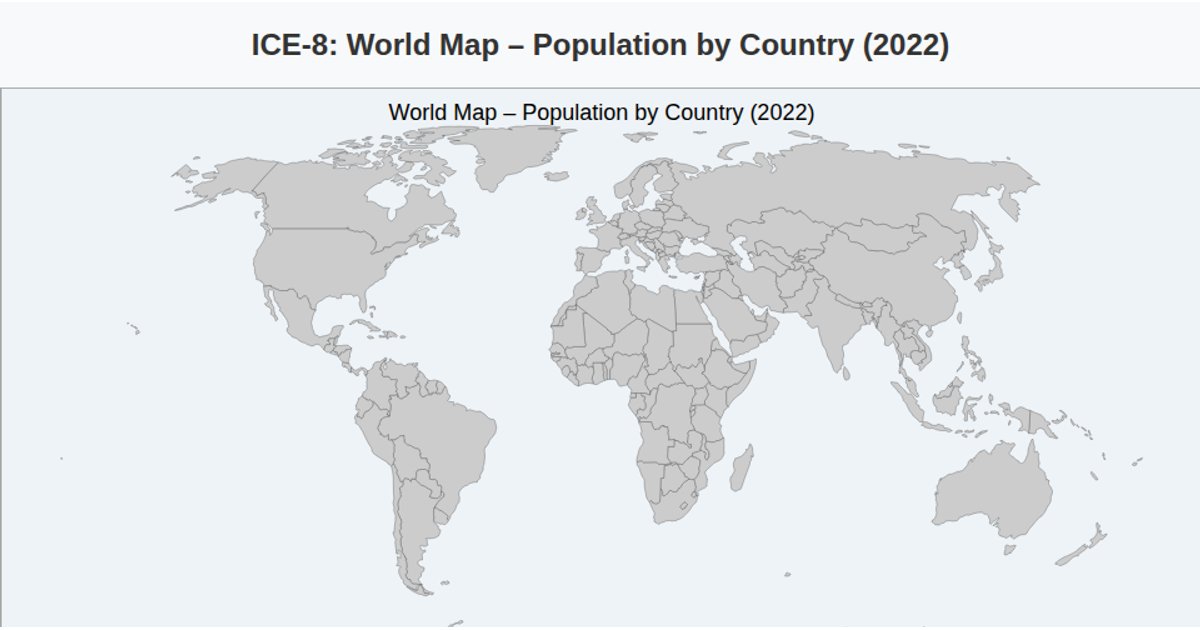
This choropleth map displays population distribution across selected countries, using an orange sequential color scale to encode values from a CSV dataset. Built with D3.js v7 and TopoJSON, the visualization projects country boundaries with `d3.geoNaturalEarth1` and renders them as SVG paths via `d3.geoPath`. Hovering triggers a tooltip showing country ID and formatted population, while a gradient legend with an axis communicates the color scale. The base geometry comes from the world-atlas TopoJSON file, and countries without data appear gray.
AI-generated descriptionMIT Licensed




Comments
Sign in to join the discussion.