🌍 Public
Fork of React & D3 Starter
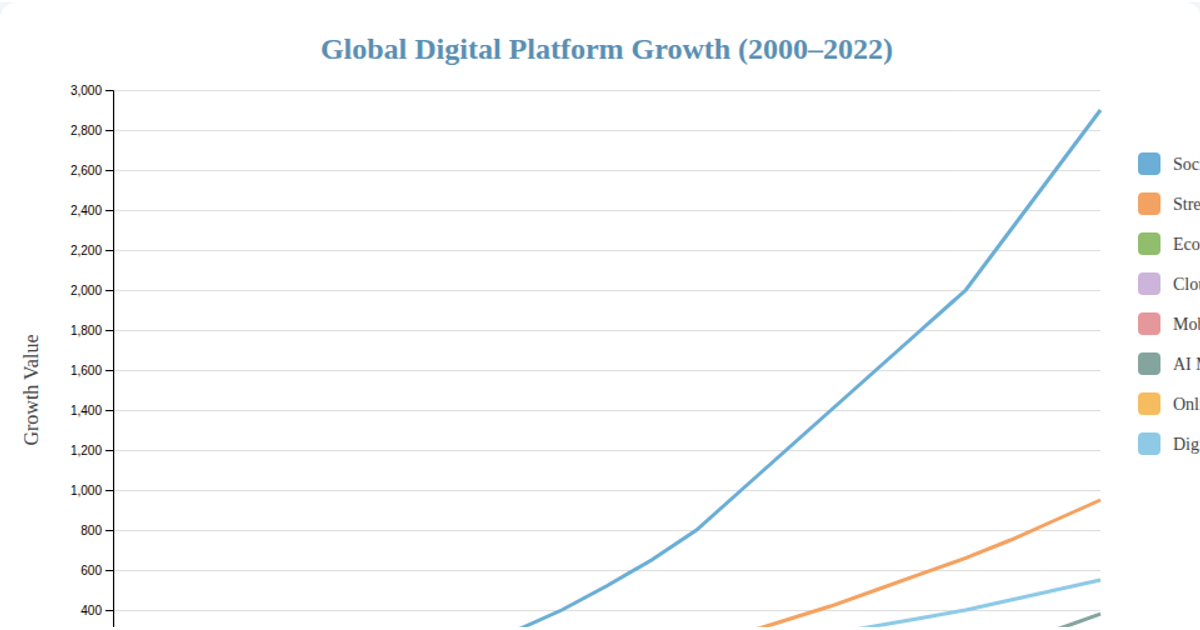
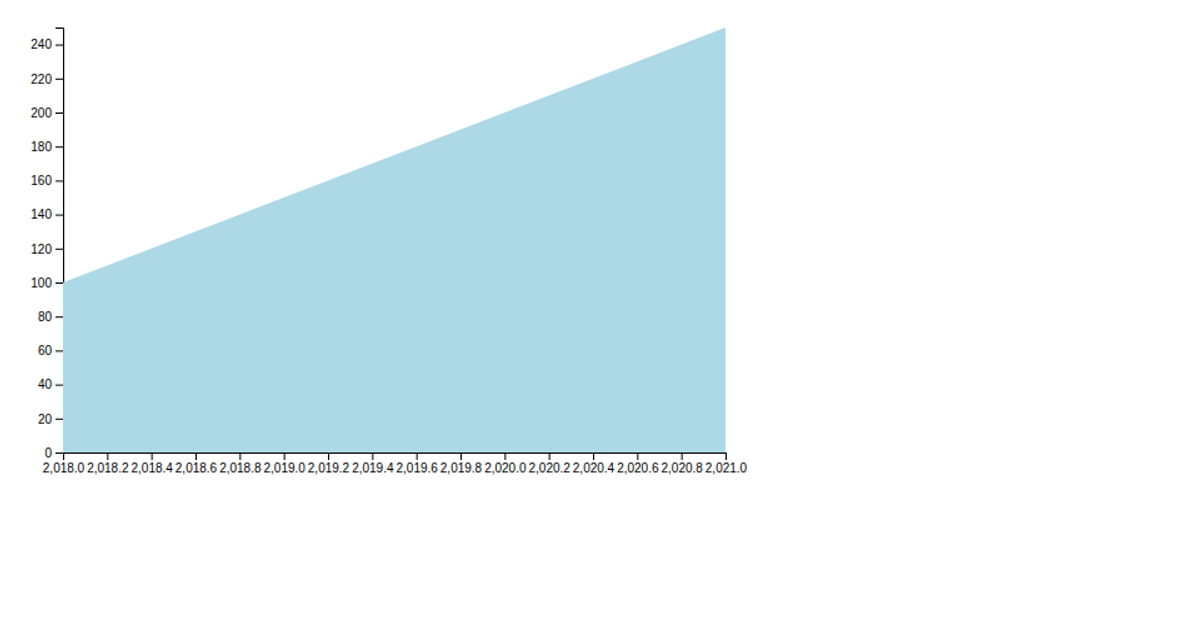
This stacked area chart visualizes global entertainment industry revenue from 2000 to 2022 across eight sectors, including streaming, gaming, music, and live events. The SVG rendering uses D3 v7 with `d3.stack()` to layer the data series, `d3.area()` to generate the filled paths, and `d3.scaleOrdinal()` for color mapping. The chart includes axis labels, grid lines, and a legend, with data loaded from a CSV file via `d3.csv()`.
AI-generated descriptionMIT Licensed




Comments
Sign in to join the discussion.