🌍 Public
Question3
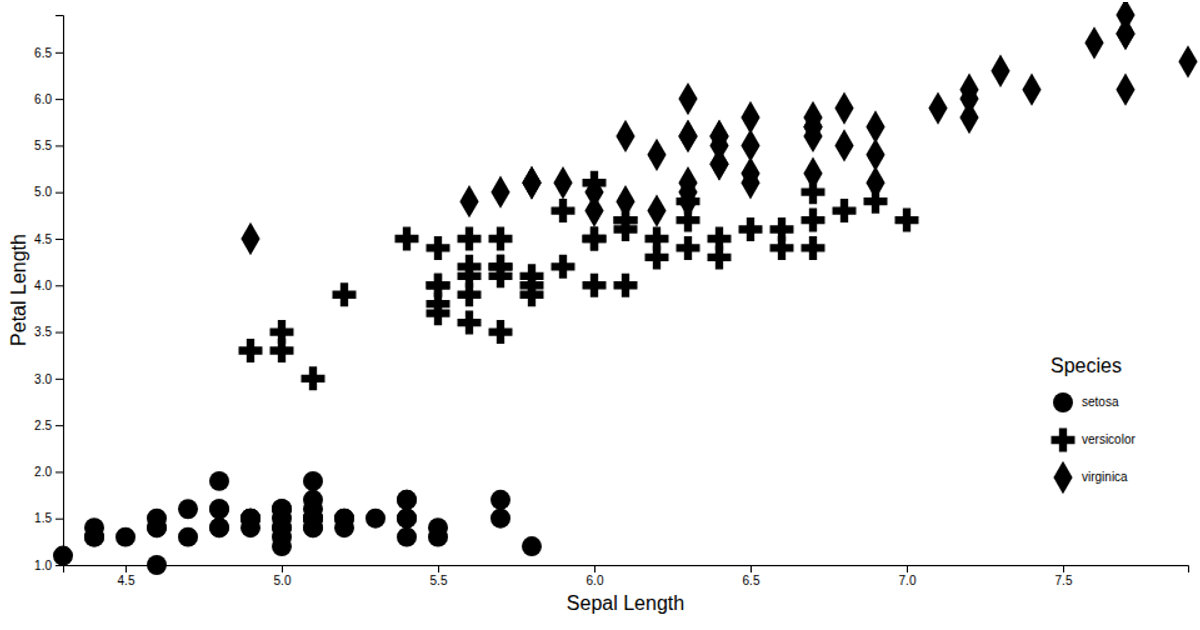
This scatter plot visualizes the relationship between sepal length and petal length in the Iris dataset, using different marker shapes to distinguish species. It demonstrates d3's shape encoding via `d3.symbol` and `symbolsFill`, with a custom shape legend generated by `shapeLegend.js`. The visualization loads data from a remote CSV, parses it with `d3.csvParse`, and renders axes using `d3.axisLeft` and `d3.axisBottom` from imported D3 modules. The chart updates reactively through state management and a render function that re-calls the plotting logic.
AI-generated descriptionMIT Licensed




Comments
Sign in to join the discussion.