🌍 Public
William_Task9_10
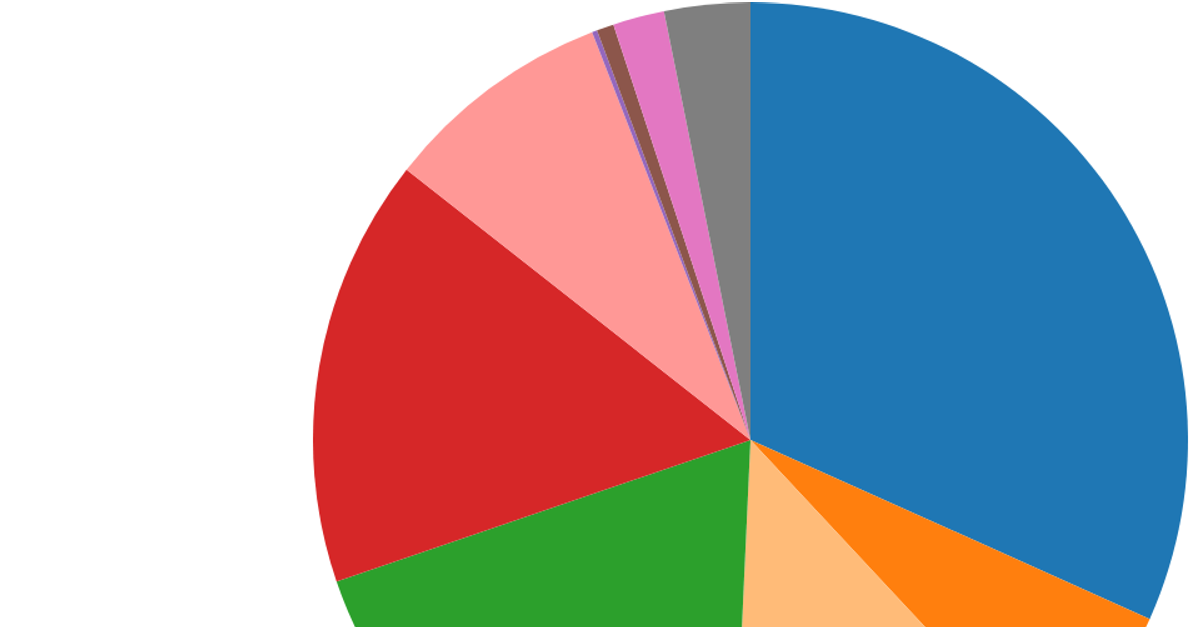
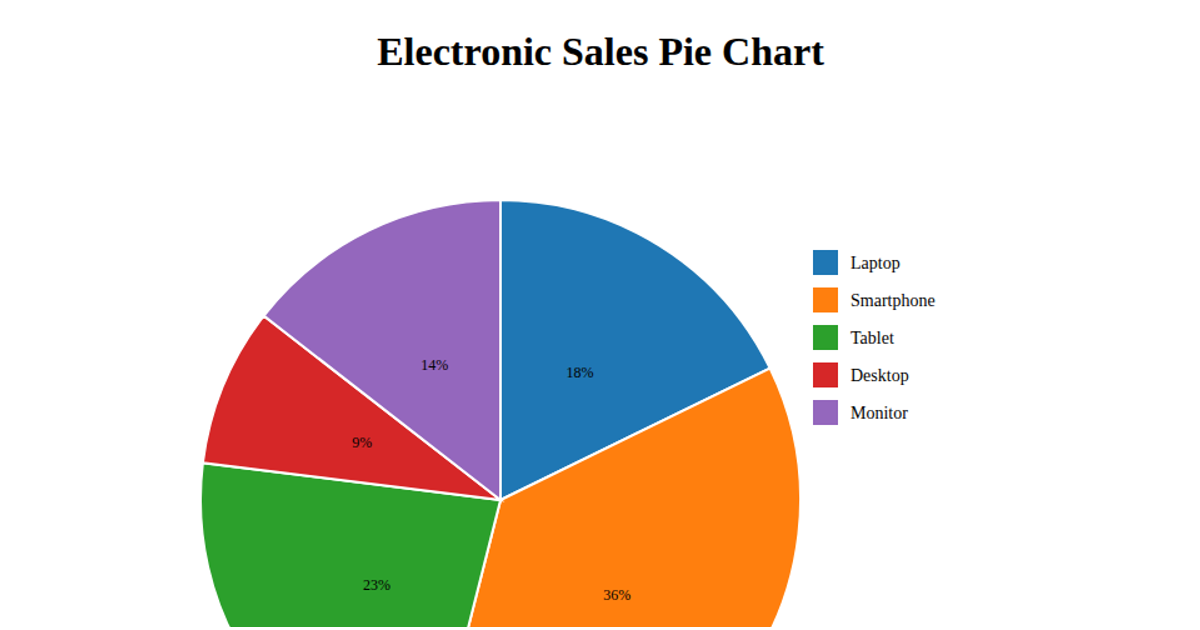
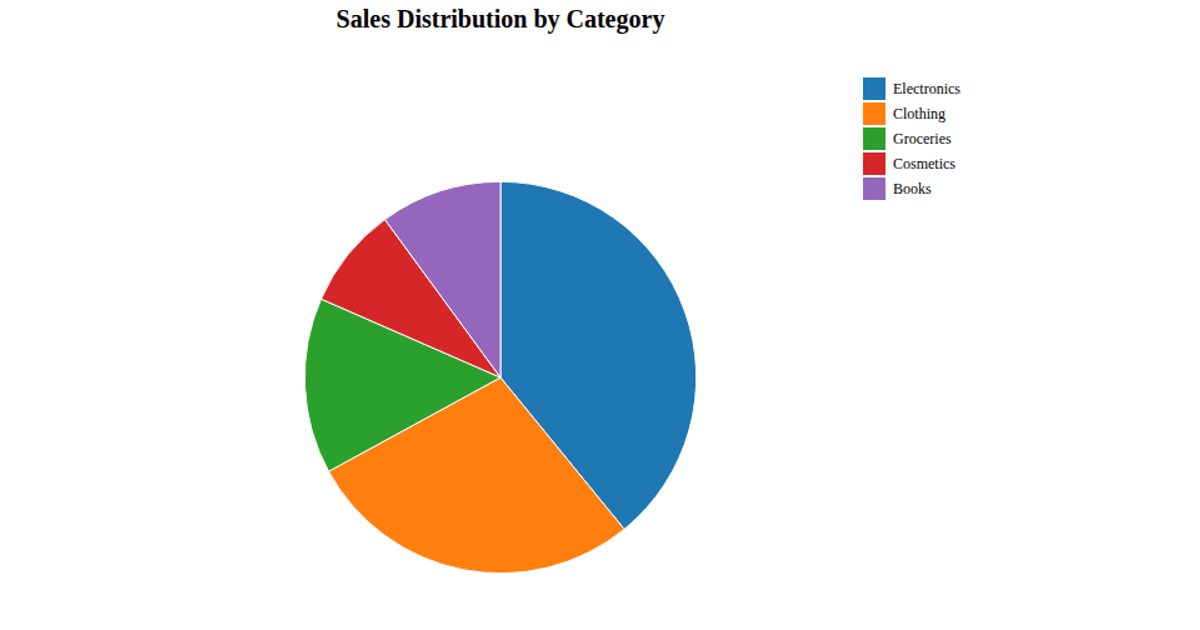
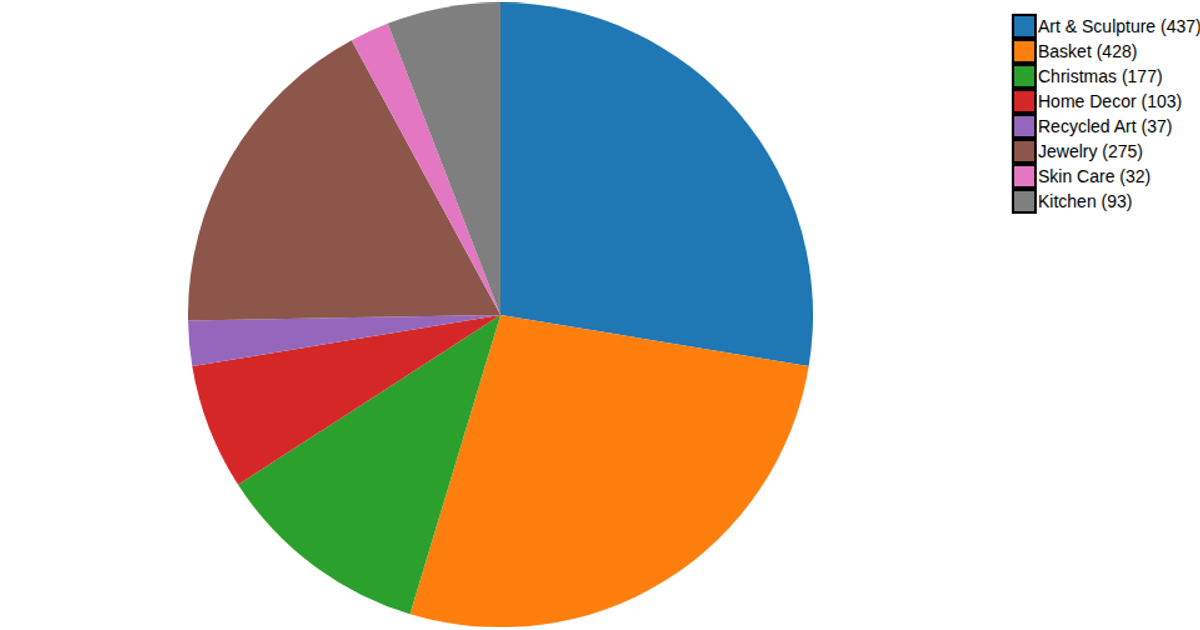
This pie chart visualizes the proportion of units sold for each product ID from an inventory CSV file. The visualization uses D3.js v7 to load the data, transform it into name-value pairs, and render a categorical pie chart. The code applies the d3.pie and d3.arc APIs to generate the pie segments and a d3.scaleOrdinal color scheme with the category10 palette. Each slice is labeled with the product ID and rendered as an SVG within a 500 by 500 pixel canvas.
AI-generated descriptionMIT Licensed




Comments
Sign in to join the discussion.