🌍 Public
09 - customizing axes - dataviz 2018
Zzach b.
Last edited Nov 16, 2021
Created on Nov 16, 2021
Forked from 07 - let's make a bar chart - dataviz 2018
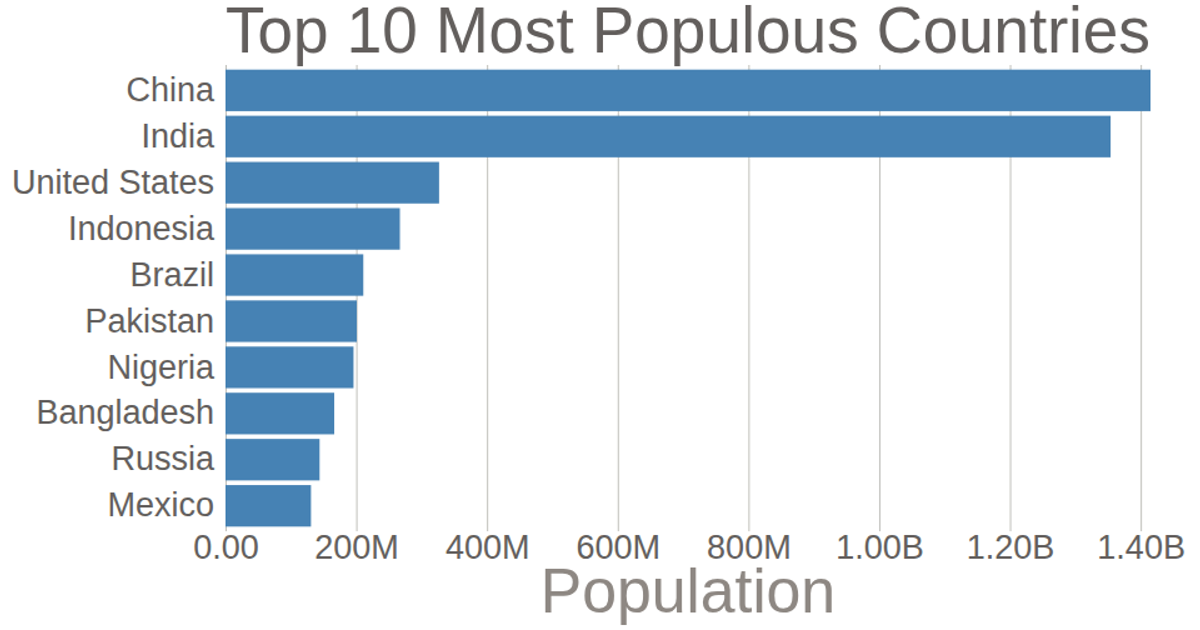
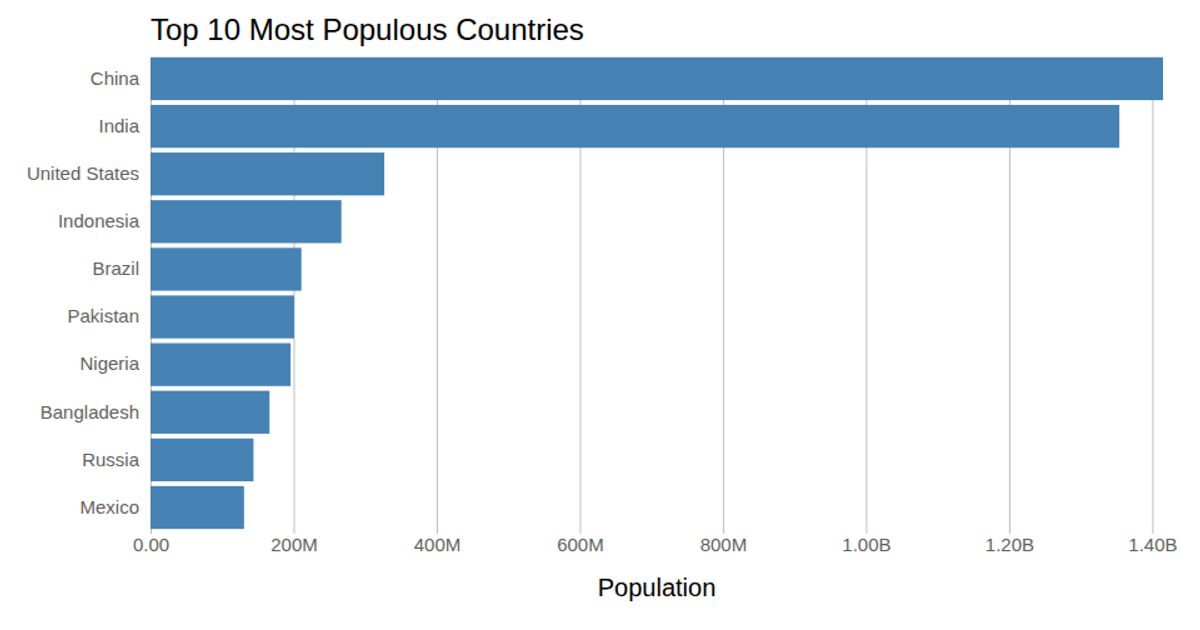
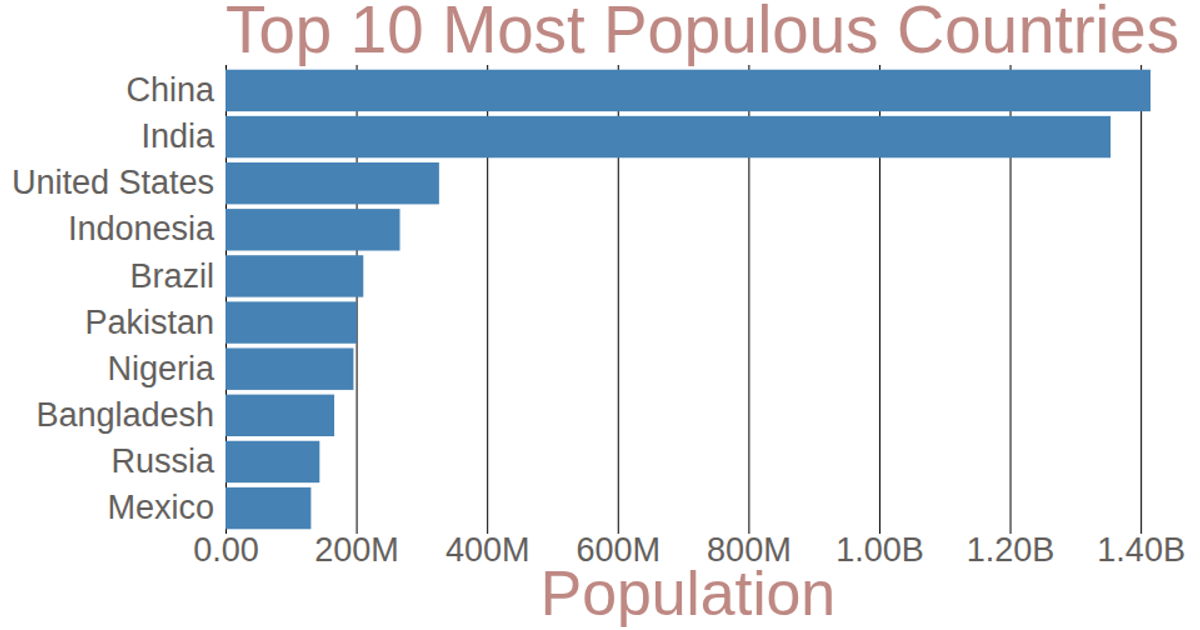
This bar chart displays the population of the top 10 most populous countries using 2018 estimates from the United Nations World Population Prospects. The chart uses D3 v7’s `scaleLinear` and `scaleBand` for axes, with a customized `axisBottom` that formats tick labels (e.g., converting G to B) and removes domain lines. Left axis labels are simplified by deleting ticks. The SVG rendering includes a title and axis labels, with styling applied via CSS classes.
AI-generated descriptiondatraviz 2018 #9 - bar chart 1, csv file
-- This bar chart shows population of the top 10 most populous countries. The data comes from the year 2018 estimate in United Nations: World Population Prospects 2017. It also demonstrates customization of D3 axes.
MIT Licensed



Comments
Sign in to join the discussion.