ic6 scattered plot
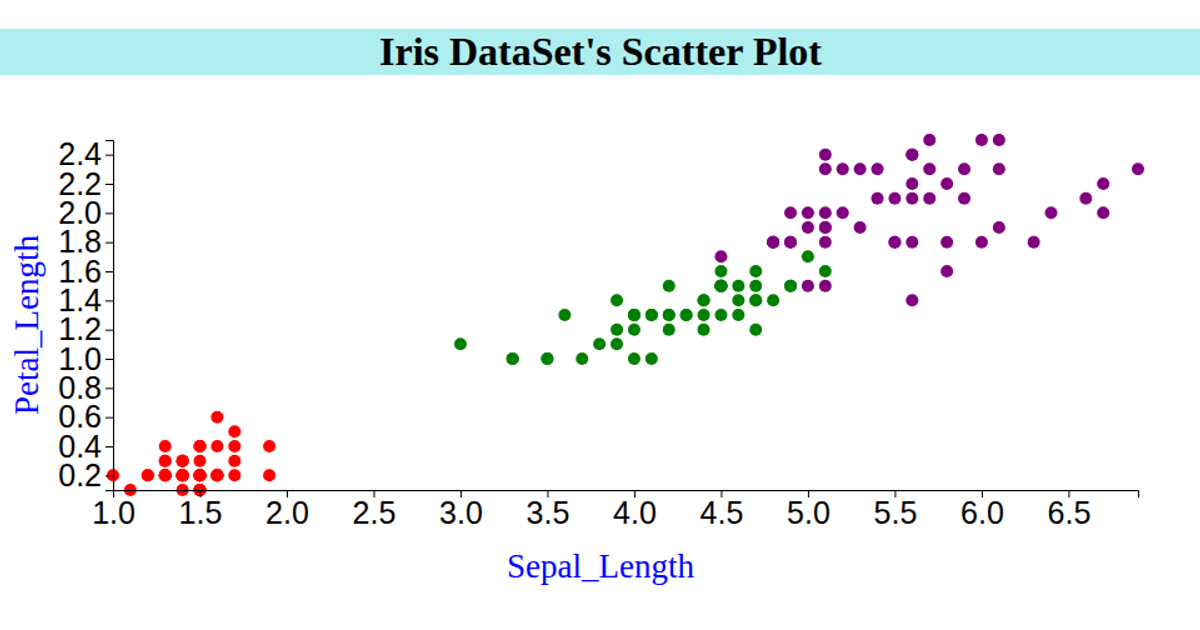
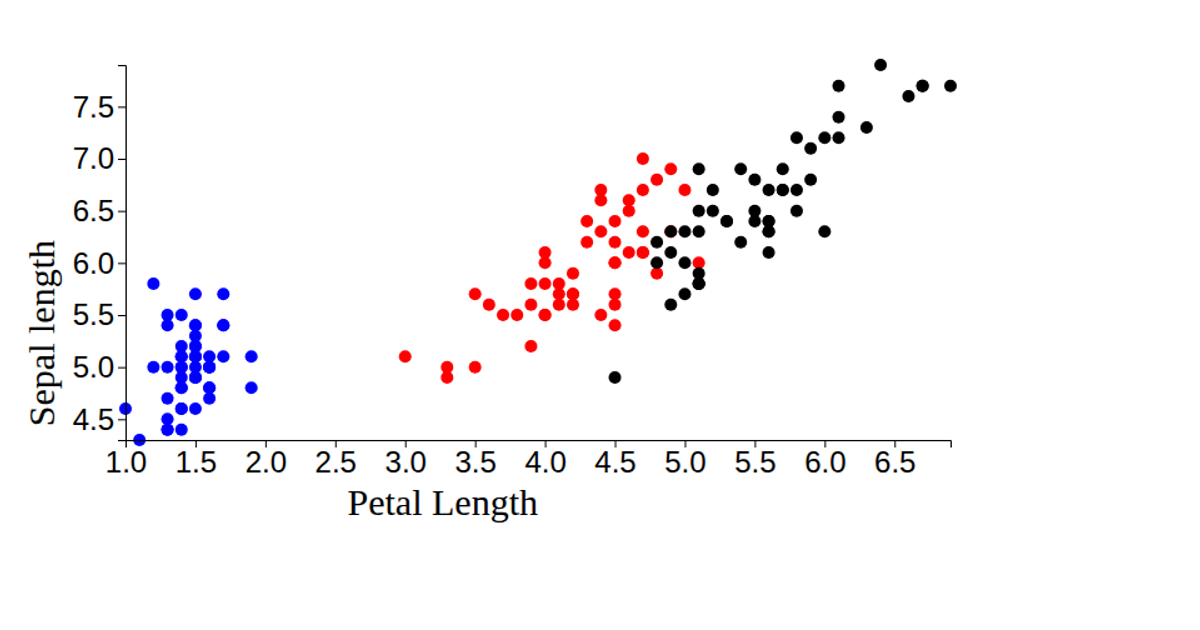
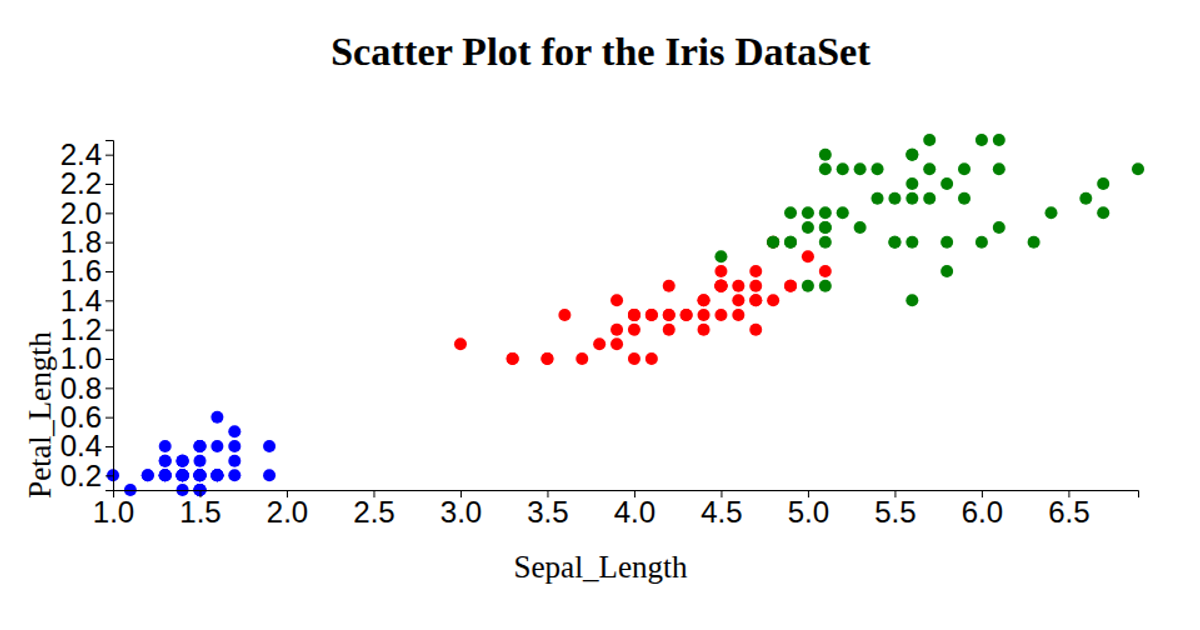
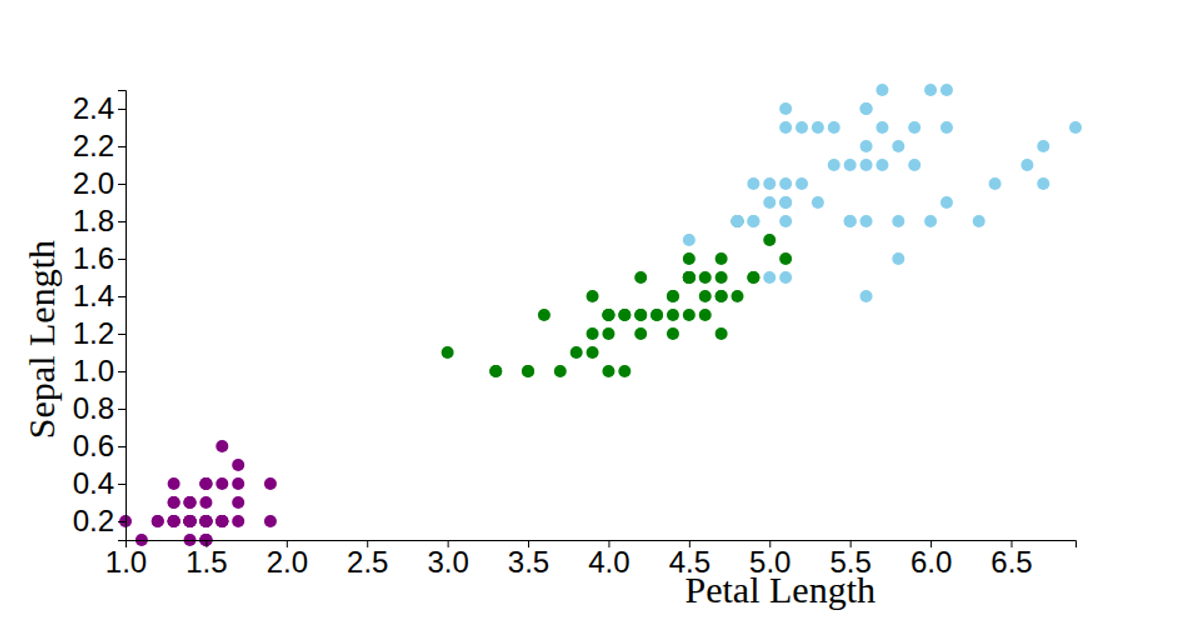
This visualization displays the Iris dataset as a scatter plot, encoding petal length on the x-axis and petal width on the y-axis, with each point colored by species (setosa in light green, versicolor in purple, and virginica in red). The code loads CSV data via `d3.csv`, parses numeric columns, and uses `d3.scaleLinear` with `d3.extent` to set the scales and `d3.axisLeft`/`d3.axisBottom` for the axes. It renders circles with SVG, though it also attempts to set `rx` and `ry` attributes (using sepal measurements) for each mark, a quirk that has no visual effect on circles. The chart is built in React with D3 v6, filling the browser window and labeling axes as "Petal length" and "Sepal length."
AI-generated descriptionA bare minimum HTML page demonstrating use of CSS and JavaScript.
See also React Starter.




Comments
Sign in to join the discussion.