🌍 Public
Sh3
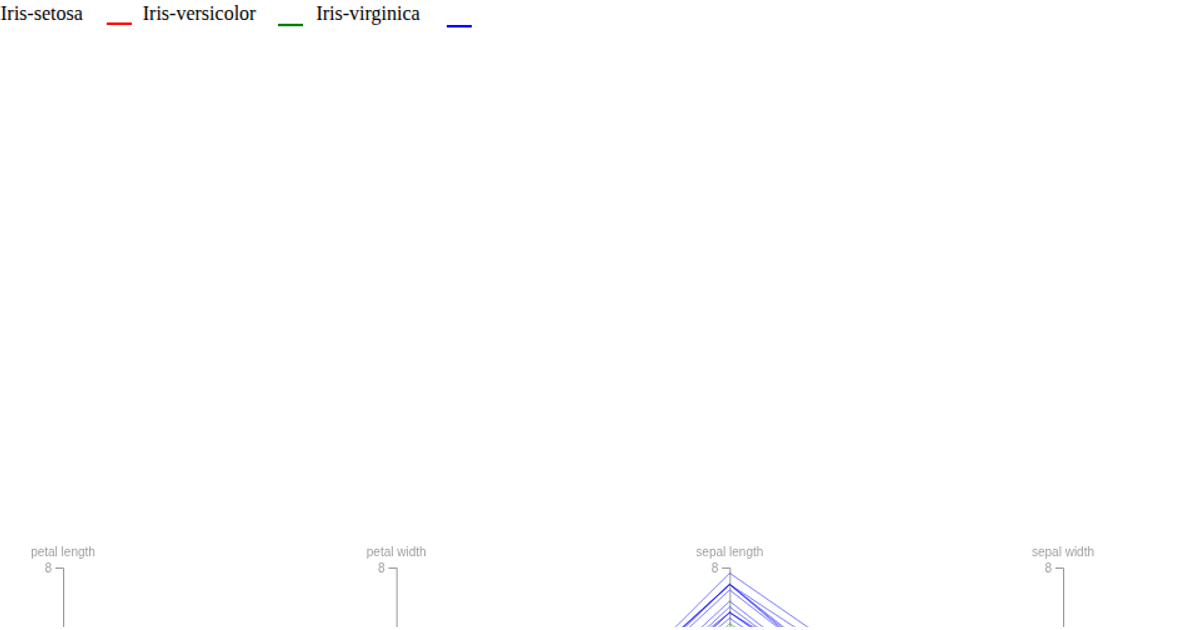
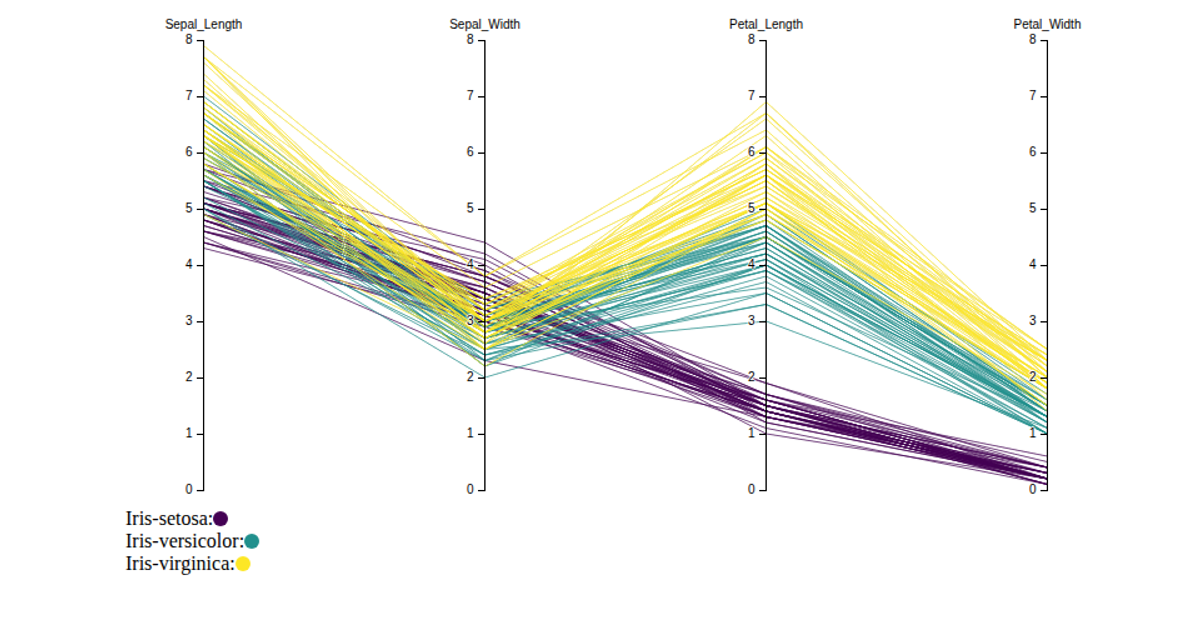
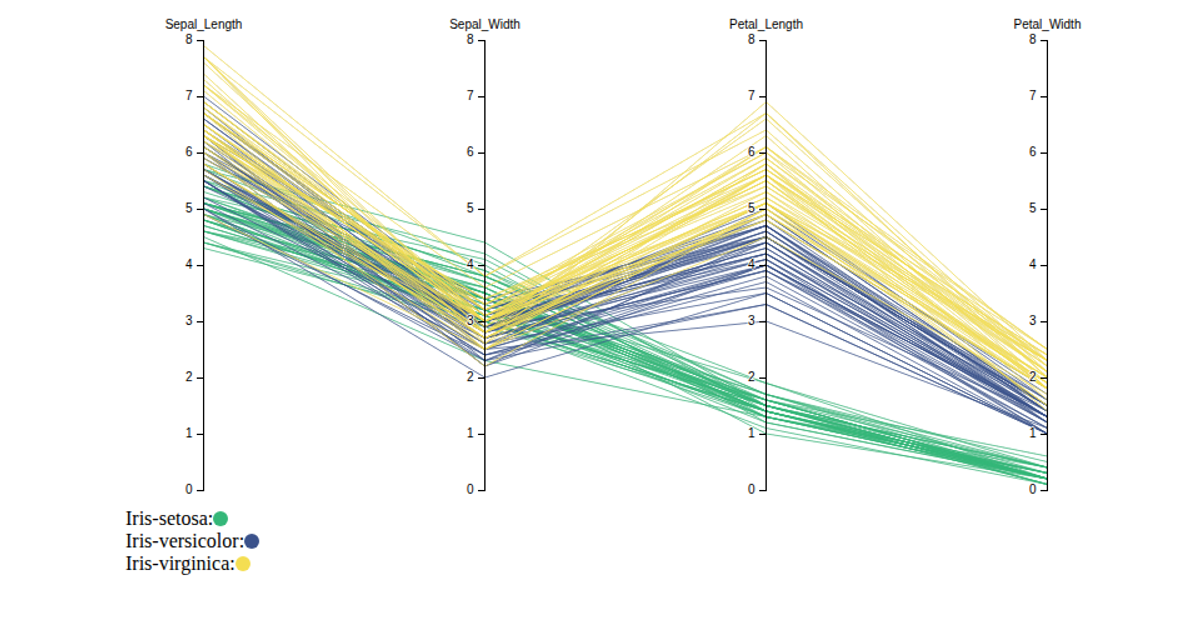
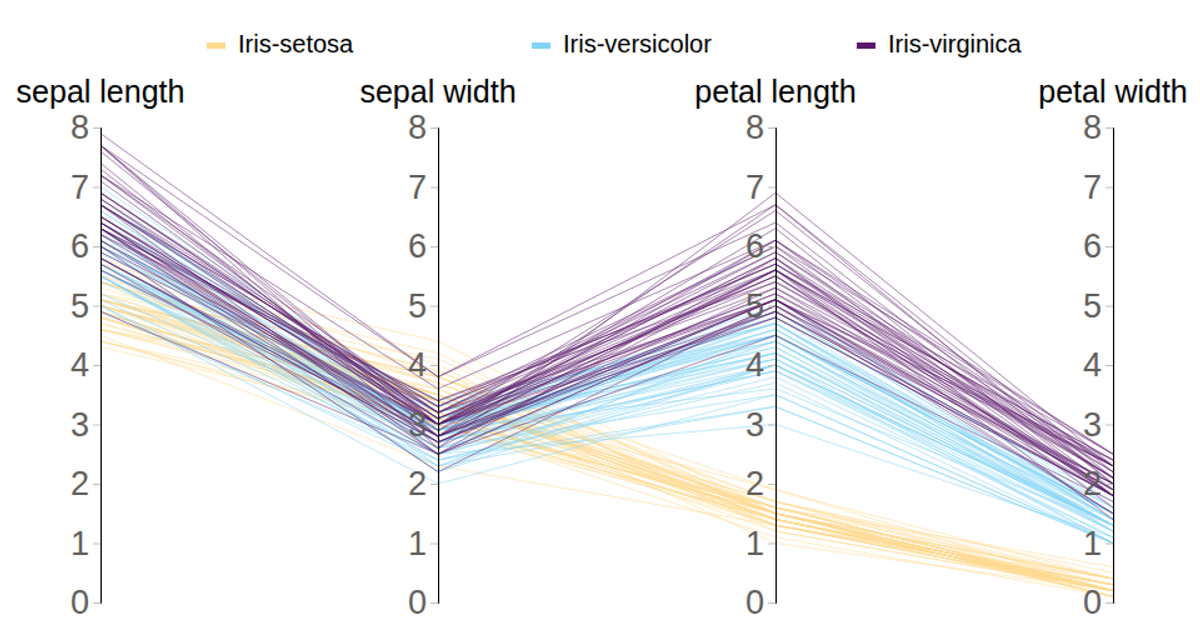
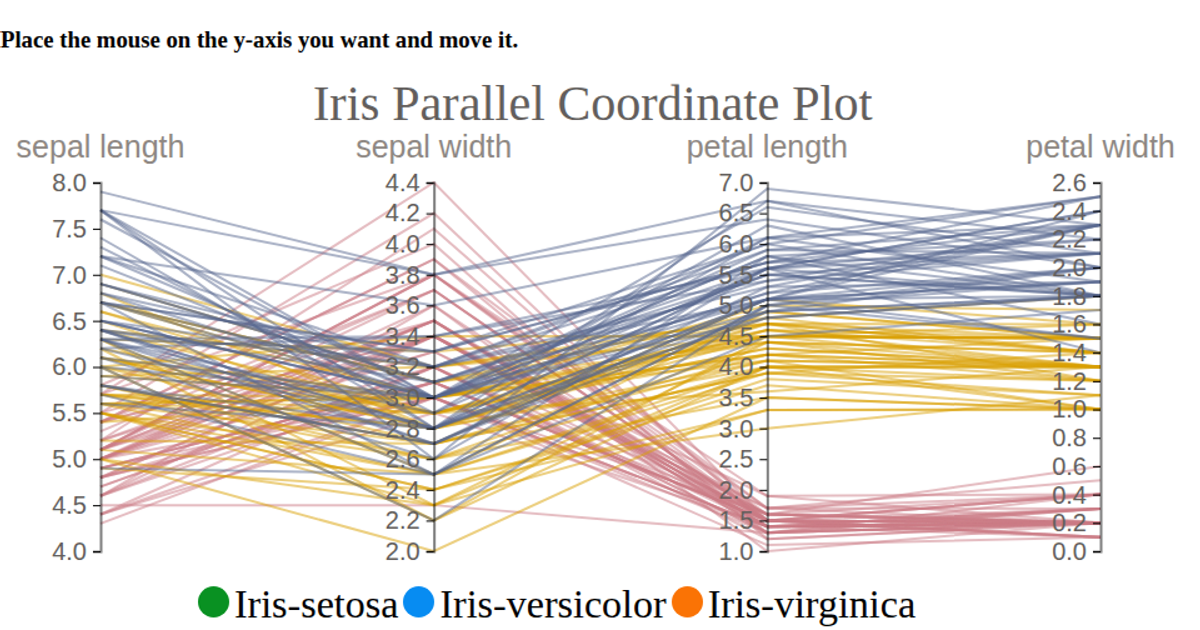
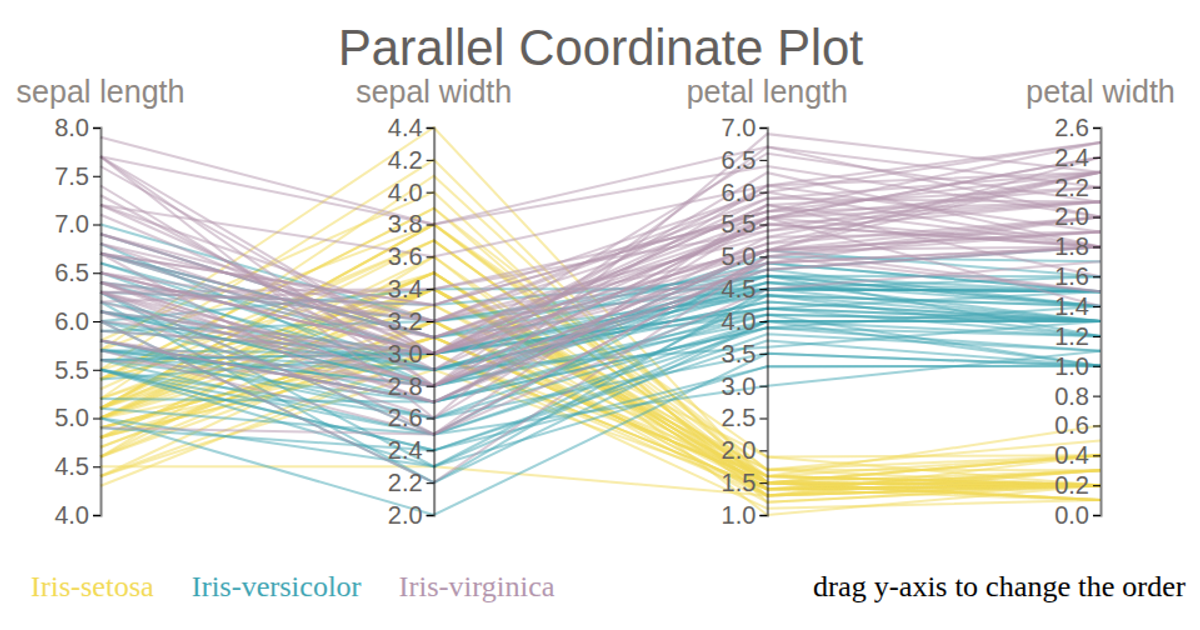
This example visualizes the Iris dataset as an interactive parallel coordinates plot. The code uses D3.js v7 with `d3.line()` to draw colored paths representing individual flowers, with colors mapped to species. A Sortable.js drag-and-drop interface allows users to reorder the five axes, triggering a re-render with the new dimension order, and the plot uses `d3.scaleLinear()` and `d3.scaleBand()` for quantitative and categorical scales. The SVG animation updates paths as axes shift, making attribute relationships explorable.
AI-generated descriptionMIT Licensed
Comments
Sign in to join the discussion.