🌍 Public
ICE-8 SOCIAL NETWORK CHART
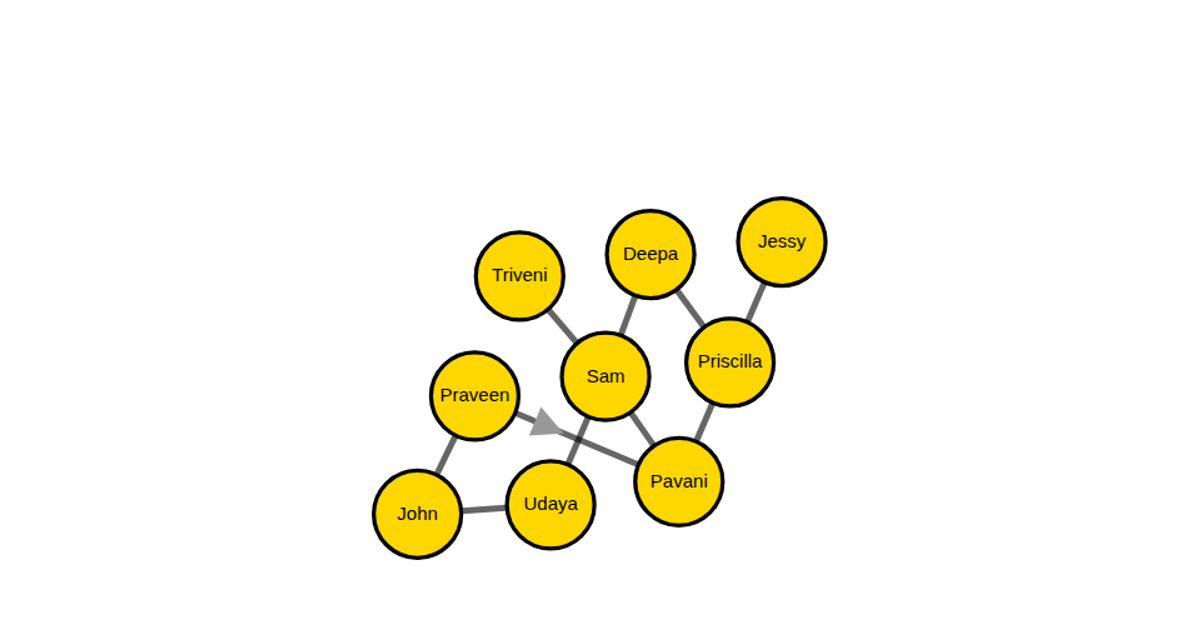
This chart shows a small social network with six labeled nodes (ACE, ZORO, LUFFY, SABO, SANJI, USSOP) connected by five weighted links. It uses an SVG force-directed layout created with `d3.layout.force`, where link thickness reflects the `weight` value from the JSON data. Nodes are rendered as yellow circles with blue text, and red lines represent connections. The simulation updates node positions on each tick, with drag behavior enabled via `force.drag`.
AI-generated descriptionsocial network chart in d3.js
MIT Licensed




Comments
Sign in to join the discussion.