🌍 Public
line
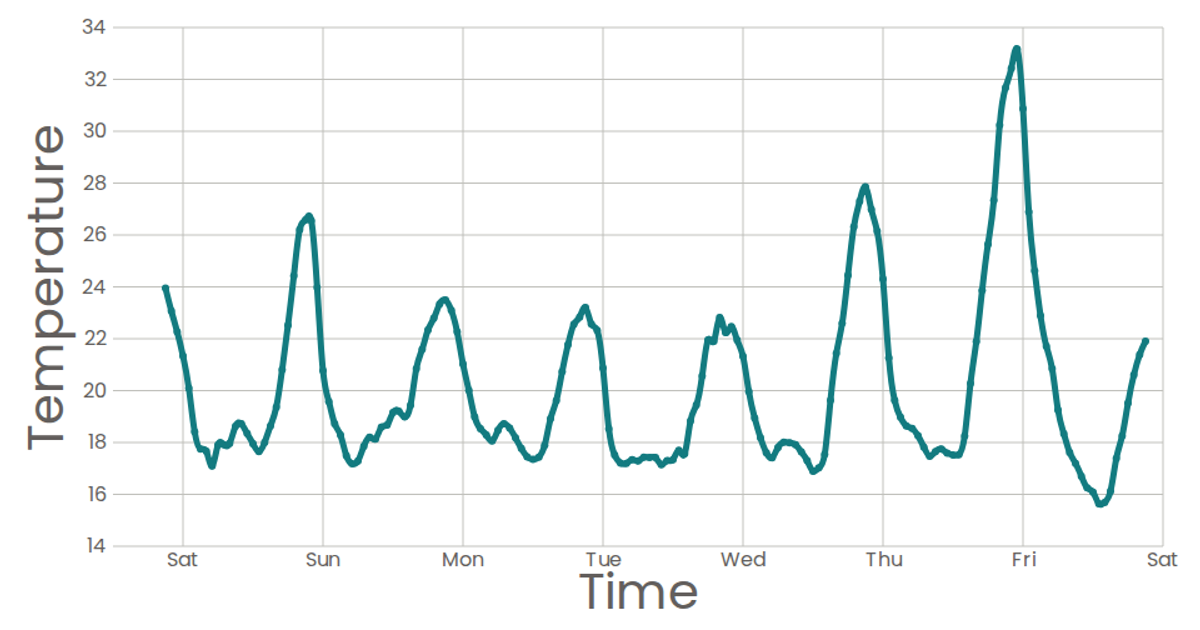
This line chart visualizes the relationship between cost (x-axis, labeled "Time") and category (y-axis, labeled "Temperature") from the Data Canvas Sense Your City dataset. Using React and D3 v5, the chart renders an SVG with axes and a natural cubic spline path connecting data points. The x-axis uses `scaleTime` with a time format, while the y-axis uses `scaleLinear`. While `Marks` includes code for circles with tooltips, the circles are commented out, leaving only the stroked line visible.
AI-generated descriptionA scatter plot of Data Canvas Sense Your City Dataset.
MIT Licensed


Comments
Sign in to join the discussion.