🌍 Public
HTML D3
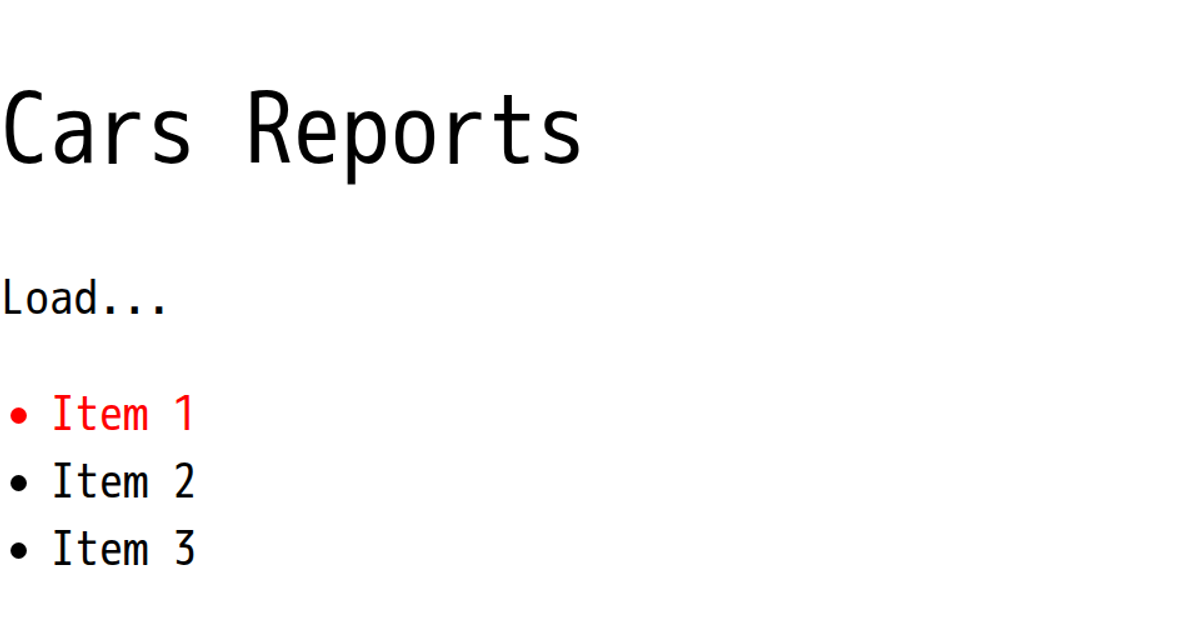
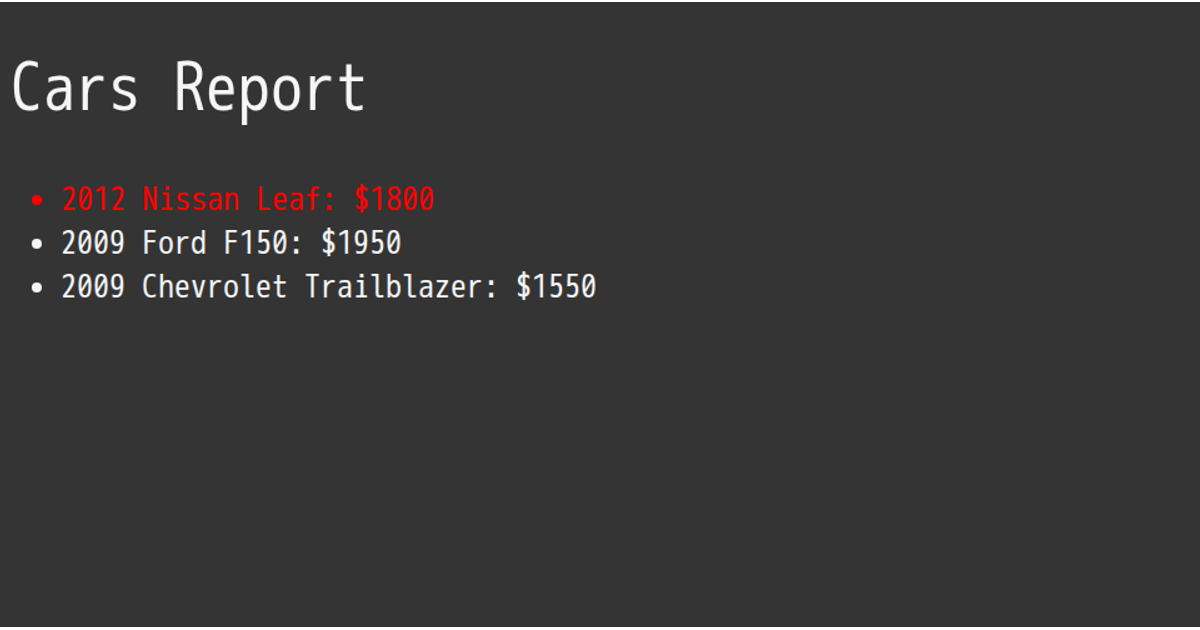
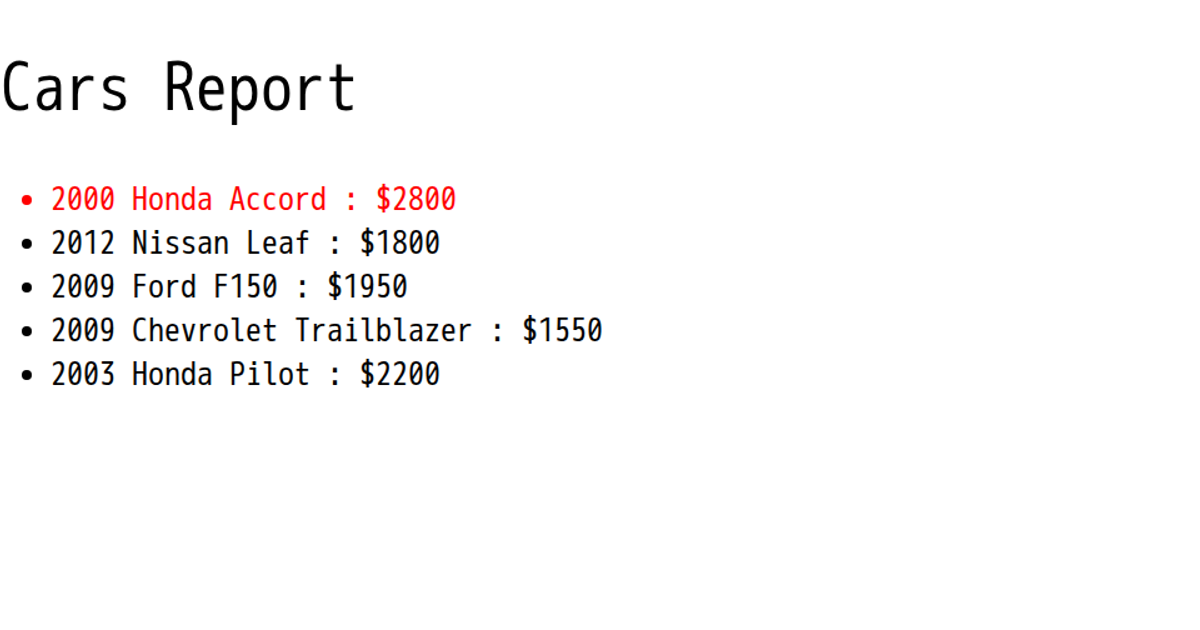
This example builds an HTML page with inline CSS and JavaScript to generate a text report from a static dataset of car listings. It parses a hardcoded JSON array of car objects (year, make, model, price) using `JSON.parse`, filters cars below a price threshold, and formats each matching entry with a custom `fCars` function. The resulting report is inserted into a `<pre>` element’s text content via `document.getElementById`, demonstrating basic DOM manipulation with no visual charting or D3 APIs involved.
AI-generated descriptionA bare minimum HTML page demonstrating use of CSS and JavaScript.
See also React Starter.
MIT Licensed





Comments
Sign in to join the discussion.