🌍 Public
Aggregated Event Sequences with Attribute Histograms
Ffloresh
Last edited Mar 26, 2019
Created on Mar 11, 2019
Forked from Aggregated Event Sequences with Text Search
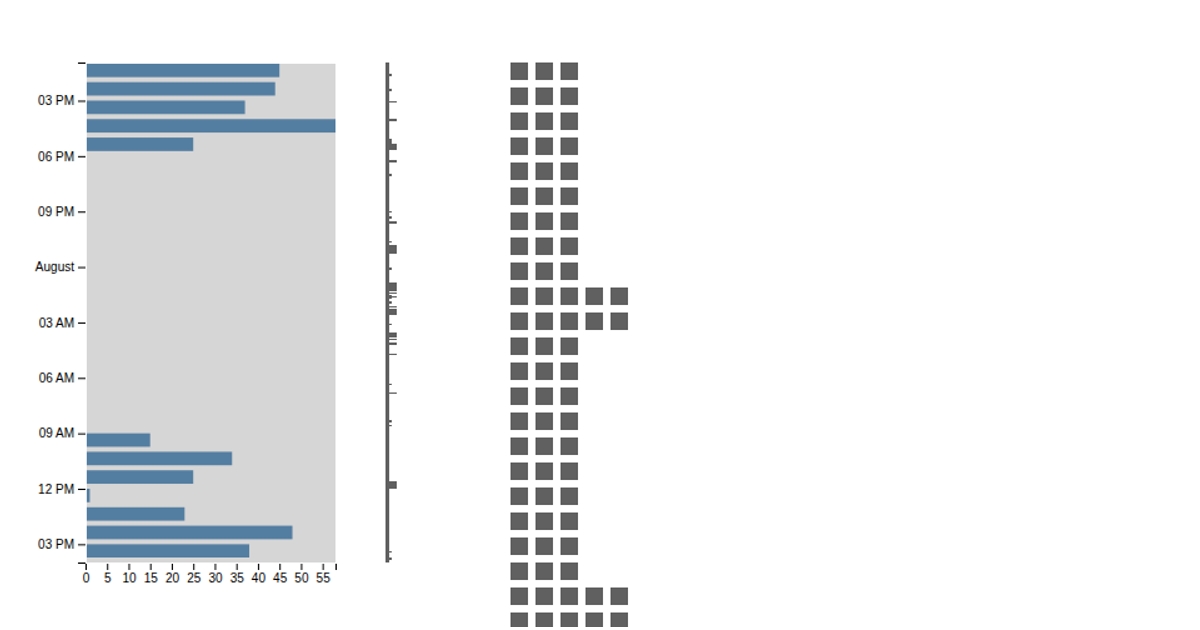
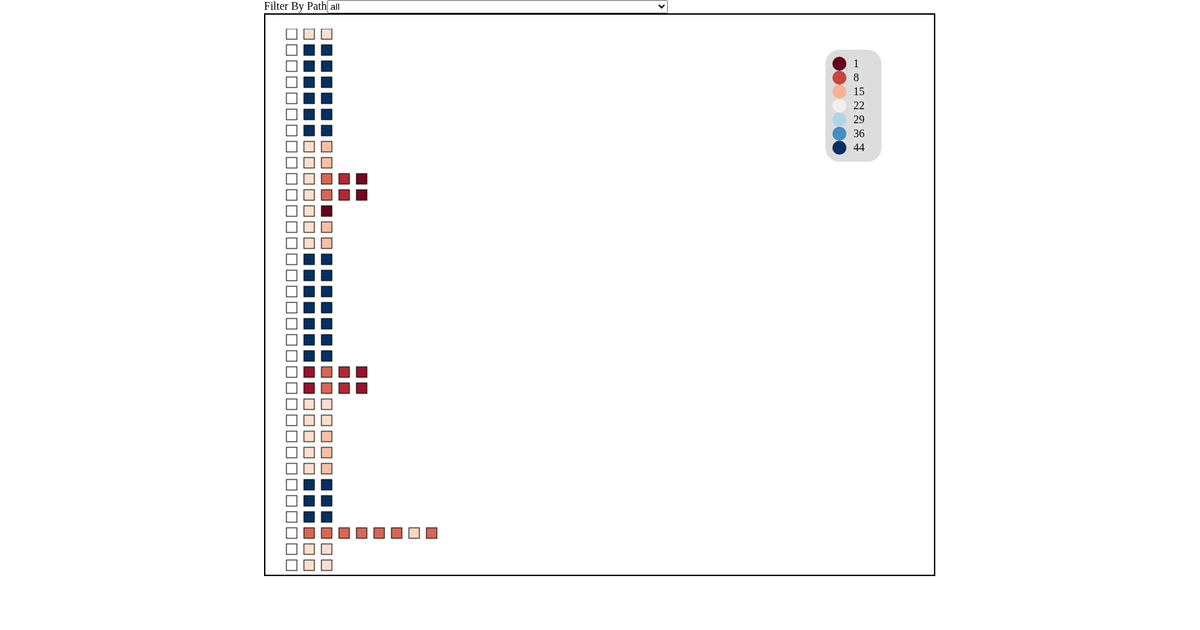
This example visualizes aggregated event sequences as horizontal rows of colored rectangles, with adjacent histograms showing the distribution of network attributes like destination IP, port, and source IP. Users can type a regular expression into a text input to highlight matching events in green and display the percentage of matched events. The visualization uses D3 v5 with `hierarchy` for data structuring, and renders SVG elements via `eventSequences`, `compactEventSequences`, and `attributeHistogram` components, which employ `scaleBand`, `scaleLinear`, and `axisLeft` for the histograms. Tooltips appear on hover, and the data comes from a JSON file containing GUI event sequences.
AI-generated descriptionMIT Licensed




Comments
Sign in to join the discussion.