🌍 Public
ICE-7 Reusuable scatterplot
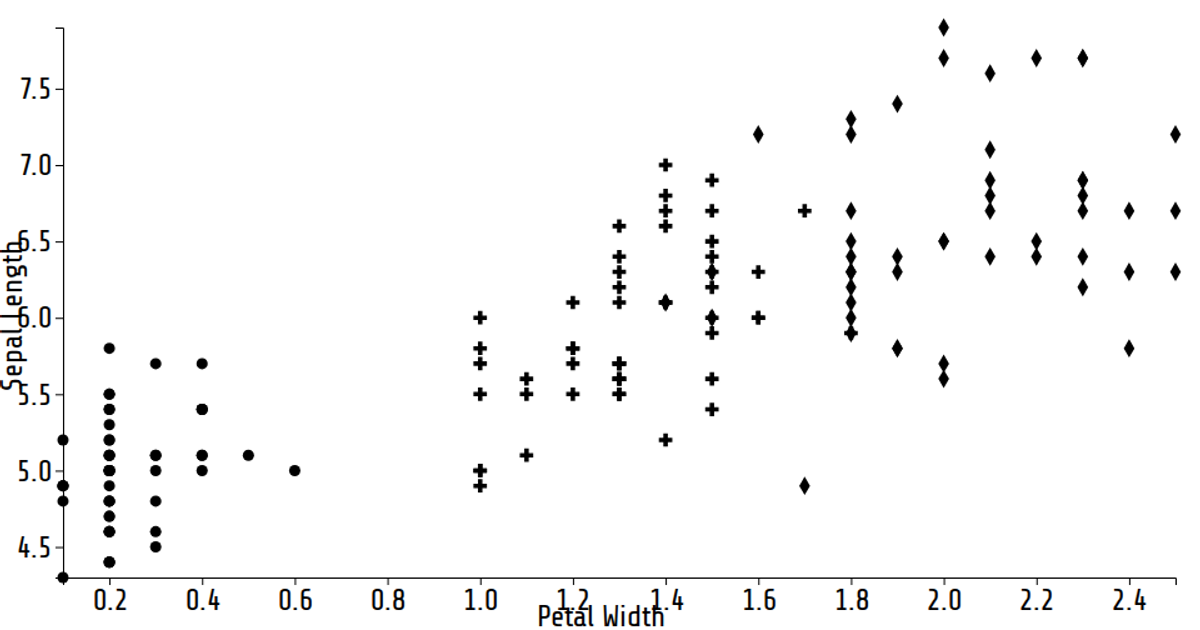
This reusable scatter plot, built with D3.js, visualizes the Iris dataset by mapping petal width and sepal length. The SVG chart encodes each flower species with a distinct shape and color: triangles for setosa, stars for versicolor, and squares for virginica. Following the "Towards Reusable Charts" pattern, the `scatterPlot` module exposes fluent setters for data, dimensions, and margins, while `scaleLinear`, `axisLeft`, and `axisBottom` handle the axes and scaling.
AI-generated descriptionA reusable scatter plot inspired by Towards Reusable Charts.
Shows the Iris Dataset.
MIT Licensed




Comments
Sign in to join the discussion.