🌍 Public
Fork of First Graph
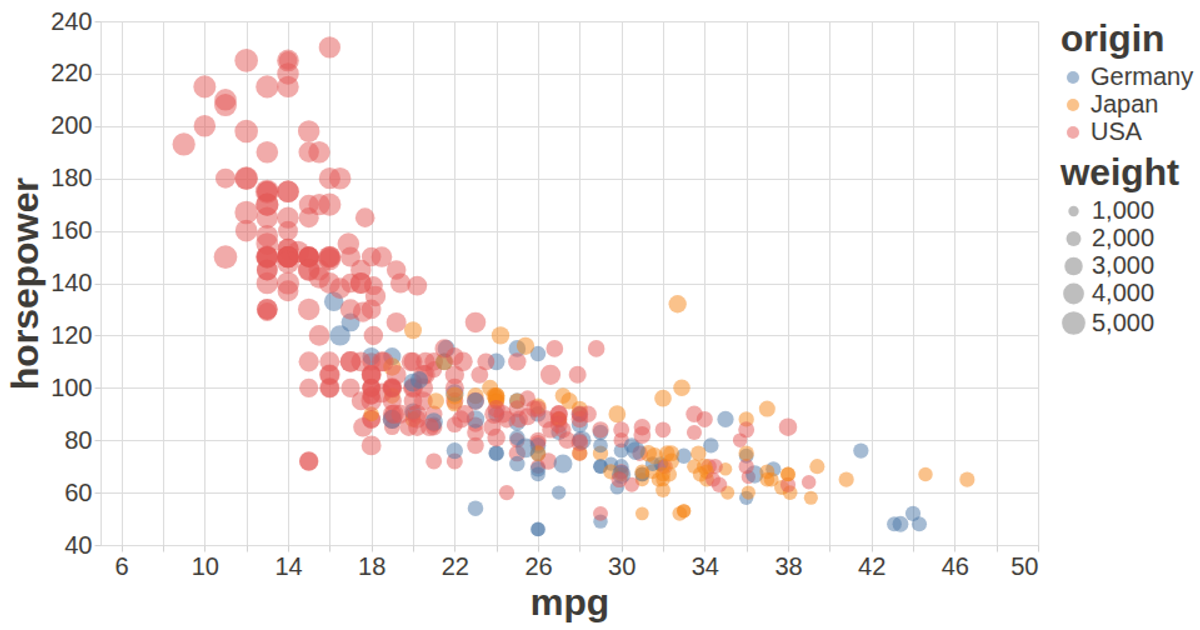
This example displays a scatter plot of automobile data, with points colored by country of origin and sized by vehicle weight. The visualization is rendered using the Vega-Lite API, specifically through the `vl` object from `vega-lite-api`. It encodes the acceleration and horsepower fields on the x and y axes, with scales set to not include zero. The plot uses `markPoint` with filled, semi-transparent circles, and includes a tooltip showing the car name. The data appears to come from a standard automotive dataset, though its exact source is not shown in the code.
AI-generated descriptionA bare minimum HTML page demonstrating use of CSS and JavaScript.
See also React Starter.
MIT Licensed




Comments
Sign in to join the discussion.