🌍 Public
Fork of Fork of Cat Data draft 2 get the map to work
Cchris.shimotake@gmail.com
Last edited May 6, 2024
Created on May 6, 2024
Forked from Fork of Cat Data draft 2 get the map to work
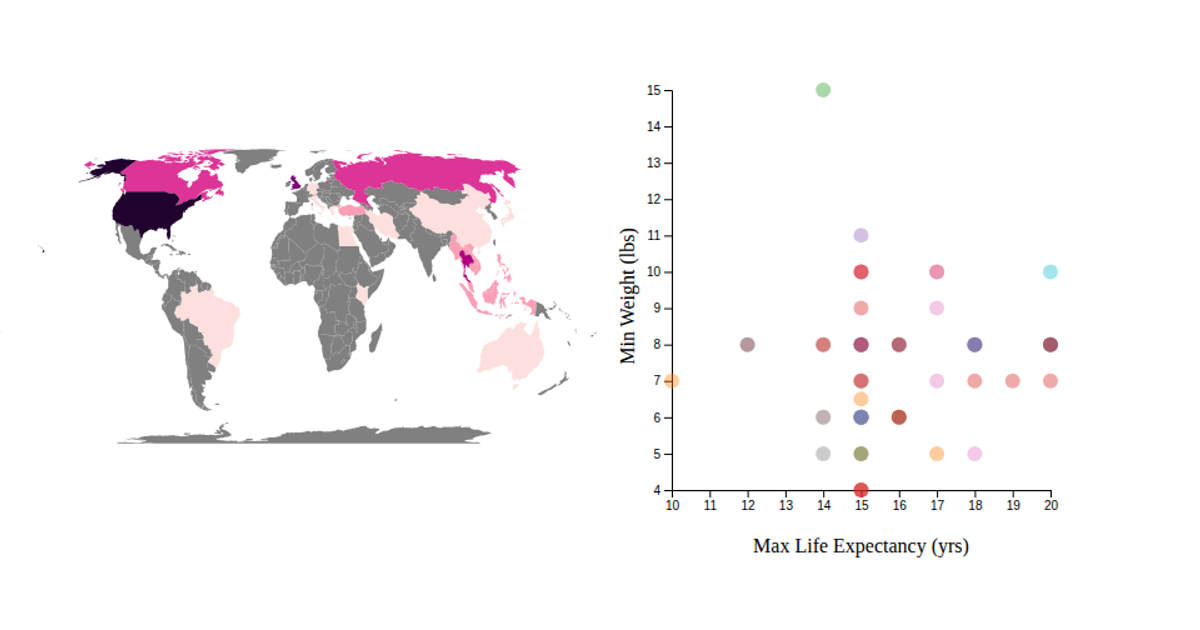
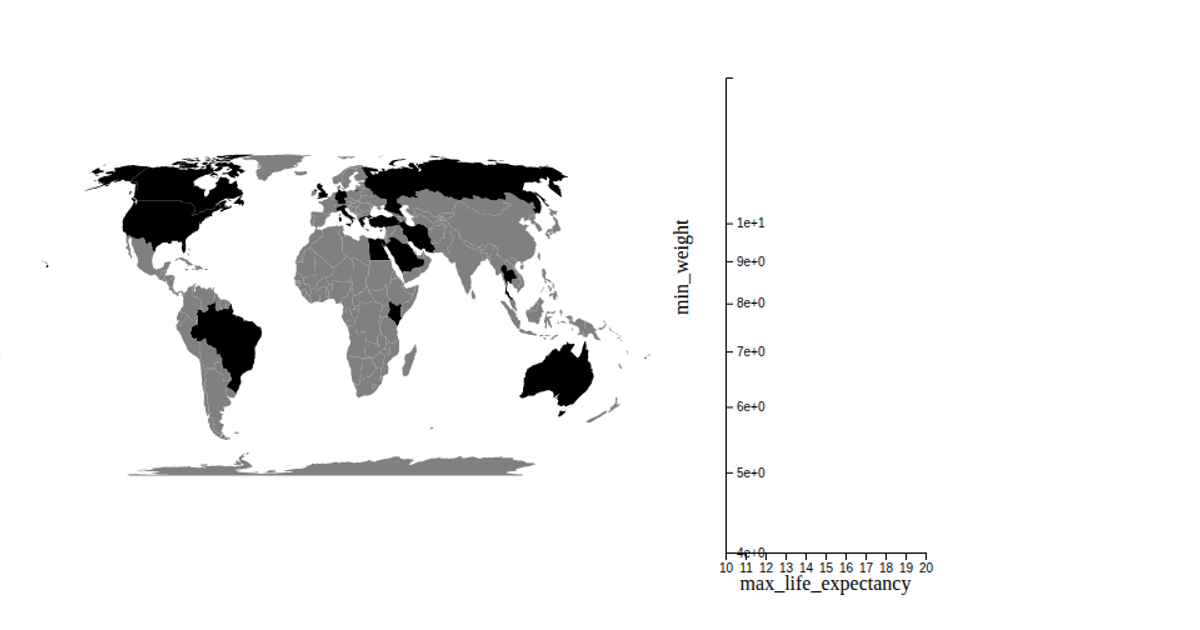
This example combines a choropleth world map with a scatter plot to visualize cat breed data. The map colors countries by the number of cat breeds originating there, while the scatter plot shows each breed’s max life expectancy and min weight. It uses d3.geoEqualEarth, d3.geoPath, d3.scaleThreshold, and d3.scaleOrdinal for rendering. The code loads data from CSV files and renders two SVG elements with animated transitions, using the d3.v6 library within a React framework.
AI-generated descriptionA bare minimum HTML page demonstrating use of CSS and JavaScript.
Cat breeds data set: https://www.kaggle.com/datasets/warcoder/cat-breeds-details/discussion
See also React Starter.
MIT Licensed





Comments
Sign in to join the discussion.