🌍 Public
Relation Graph with d3-force
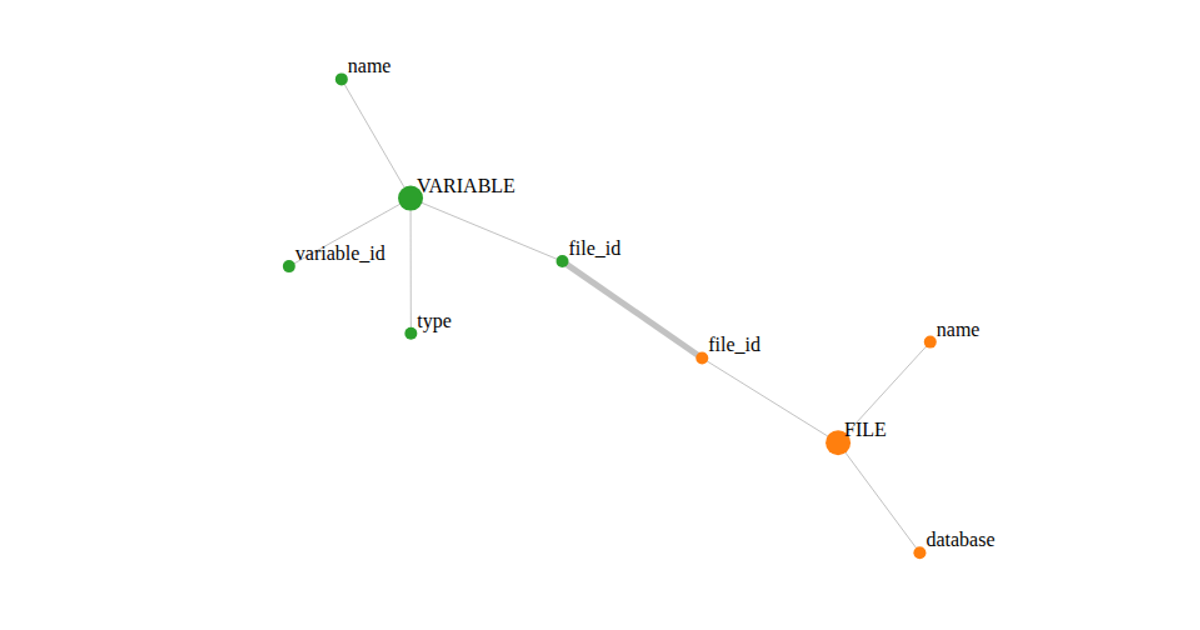
A relation graph of 410 nodes and their pairwise connections, rendered as an interactive SVG force-directed diagram. The code uses `d3.forceSimulation` with `forceLink`, `forceManyBody`, and `forceCenter` to position the nodes, with each node colored by its group via `schemeCategory10`. Clicking a node highlights all its connected links in red and marks the corresponding cells in an adjacent adjacency matrix, which is rendered as a grid of SVG rectangles. Users can drag nodes to reposition them and zoom into the graph.
AI-generated descriptionReact Starter code.
MIT Licensed






Comments
Sign in to join the discussion.