🌍 Public
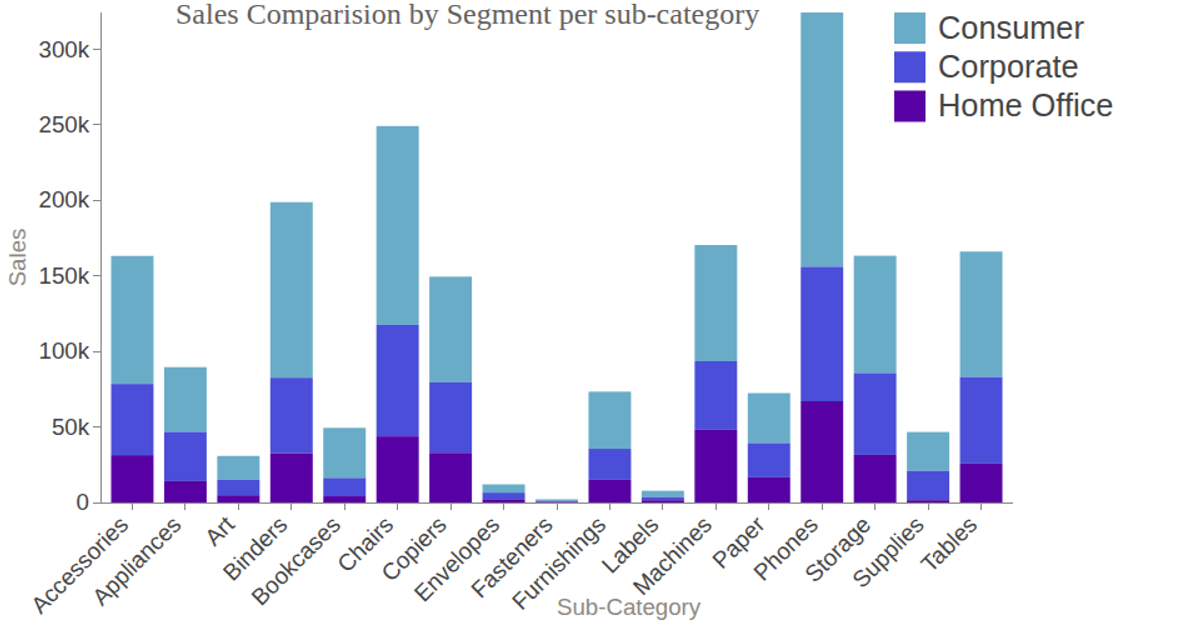
Visualization 1 (Stacked Bars)
This stacked bar chart compares sales across product sub-categories, broken down by customer segment (Consumer, Corporate, Home Office). The visualization uses D3.js to render an SVG with animated transitions, where hovering over a color legend highlights a specific segment's bars. It employs `d3.layout.stack`, `d3.scale.ordinal`, and `d3.legend.color` to structure and annotate the data, which is loaded from CSV files containing sales figures. Tooltips via `d3-tip` display exact values on interaction.
AI-generated descriptionMIT Licensed






Comments
Sign in to join the discussion.