🌍 Public
Q1c
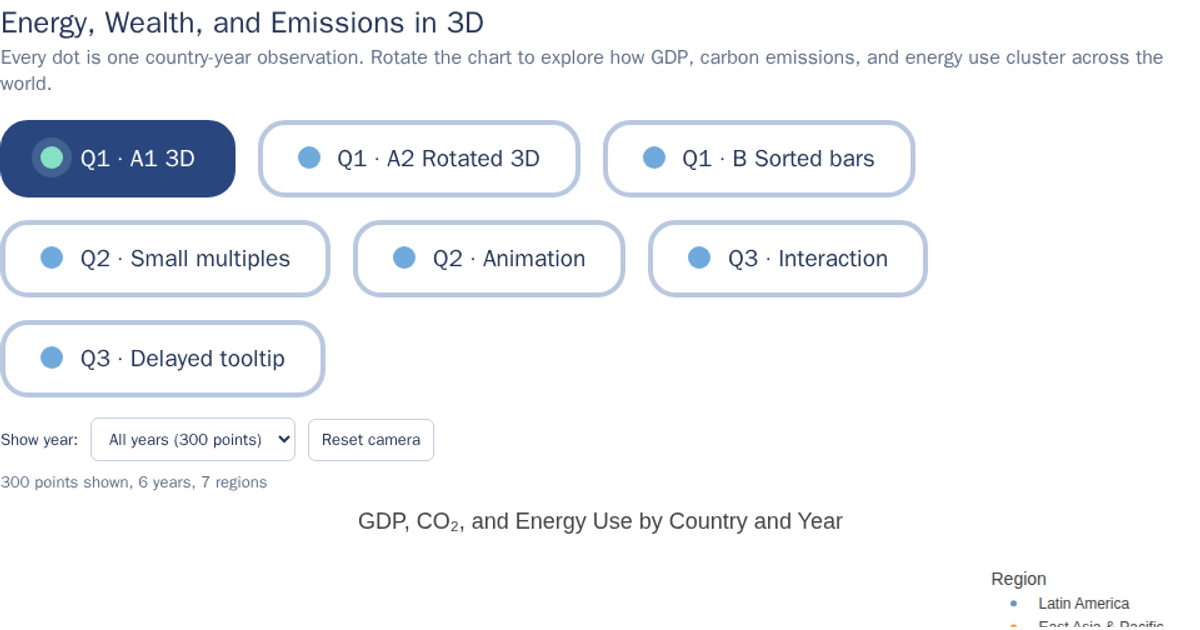
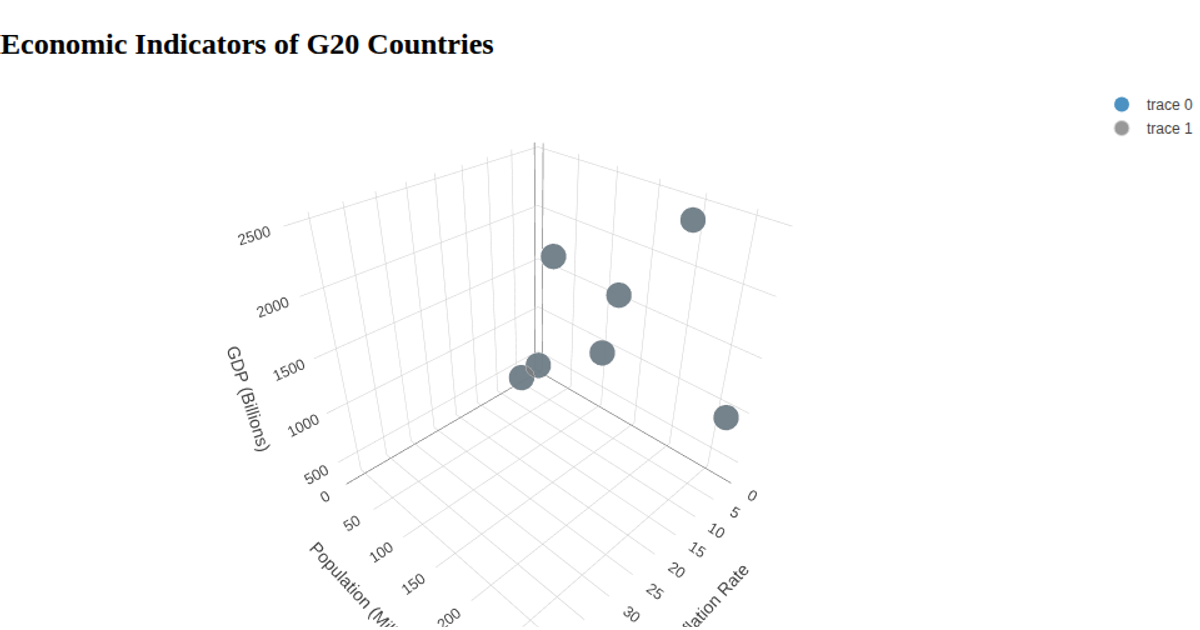
This 3D scatter plot maps countries by GDP per capita, CO2 emissions per capita, and the percentage of energy from renewable sources, with each point colored by region. Using Plotly’s `scatter3d` trace type, the visualization plots the parsed CSV data from 2018 to 2023. Hovering over a point reveals the country name and year, allowing exploration of how these three variables relate across different global regions.
AI-generated descriptionMIT Licensed



Comments
Sign in to join the discussion.