🌍 Public
Fork of World Countries Tree
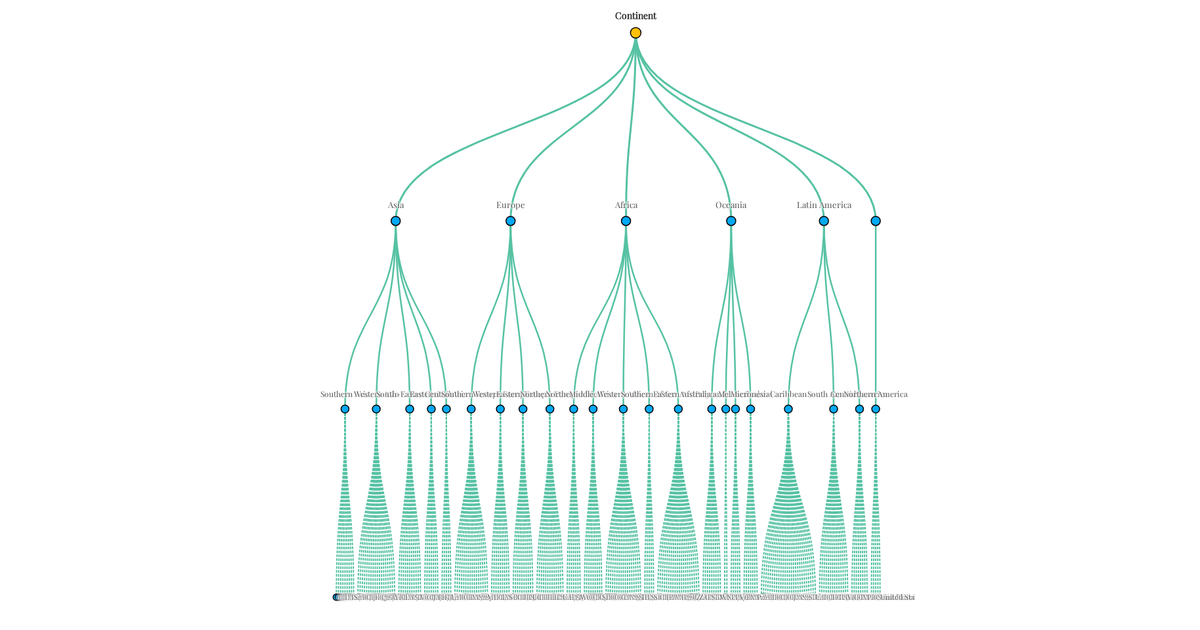
This example visualizes a decision tree from JSON data, using a horizontal icicle layout to show the hierarchy of classification rules and their predicted outcomes. The visualization employs D3.js v5 APIs including `tree`, `hierarchy`, and `linkHorizontal` to compute the layout and draw the connecting links as SVG paths. Zooming and panning functionality is implemented through the `zoom` event, which applies an SVG transform to the main group. The tree’s branching nodes display the split conditions, while leaf nodes show numeric prediction values, all rendered with a custom Playfair Display font.
AI-generated descriptionMIT Licensed




Comments
Sign in to join the discussion.