🌍 Public
Document
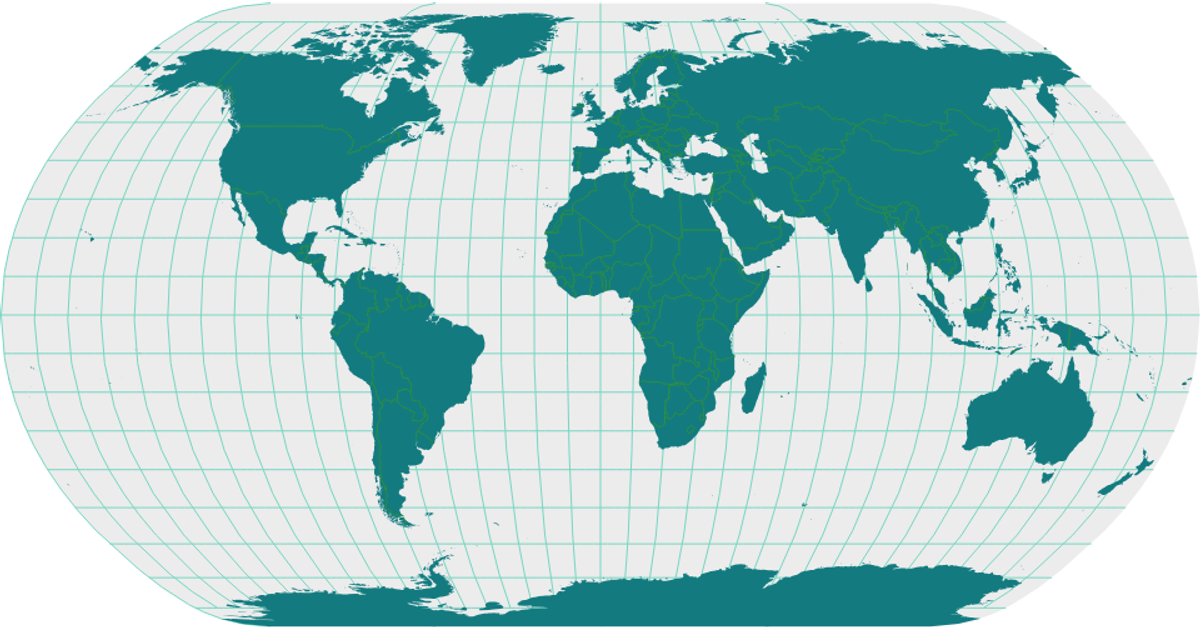
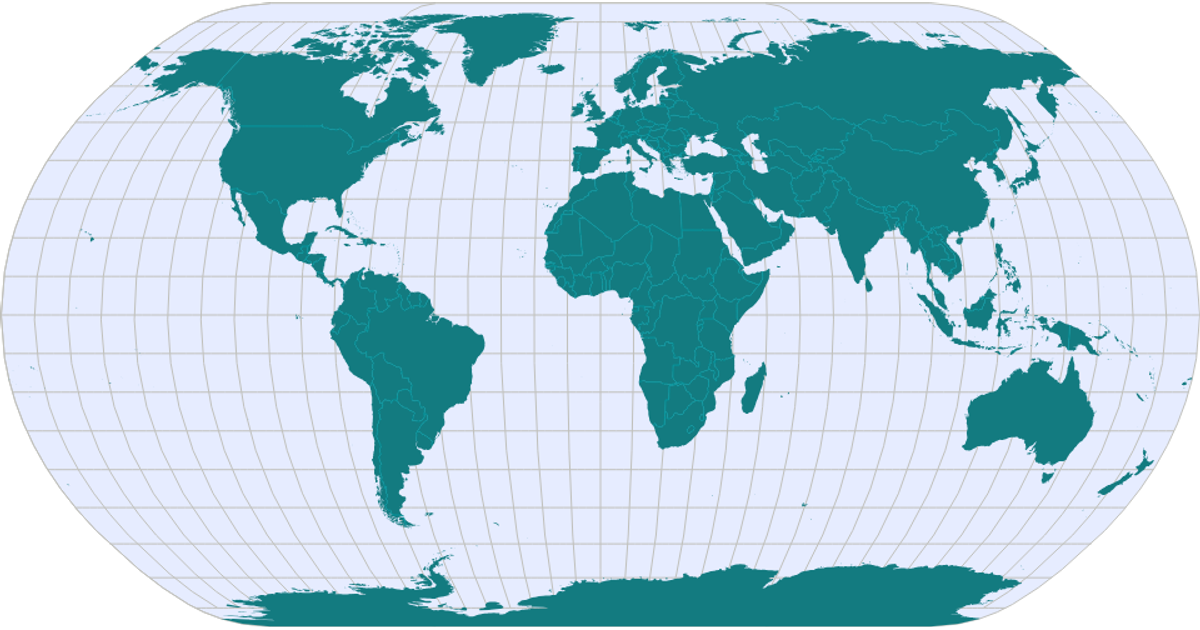
This visualization displays the track of Typhoon Haiyan across the western Pacific, with a red dashed line connecting recorded positions on a Mercator projection. The map includes graticules, land masses, and country boundaries rendered from TopoJSON data. The path is drawn using d3.svg.line with cardinal interpolation, while d3.geo.path projects geographic coordinates onto the SVG canvas. The typhoon’s intensity class is embedded in the source data but not visually encoded.
AI-generated descriptionA bare minimum HTML page demonstrating use of CSS and JavaScript.
See also React Starter.
MIT Licensed



Comments
Sign in to join the discussion.