🌍 Public
Scatter Plot w. 1 Ordered Attribute
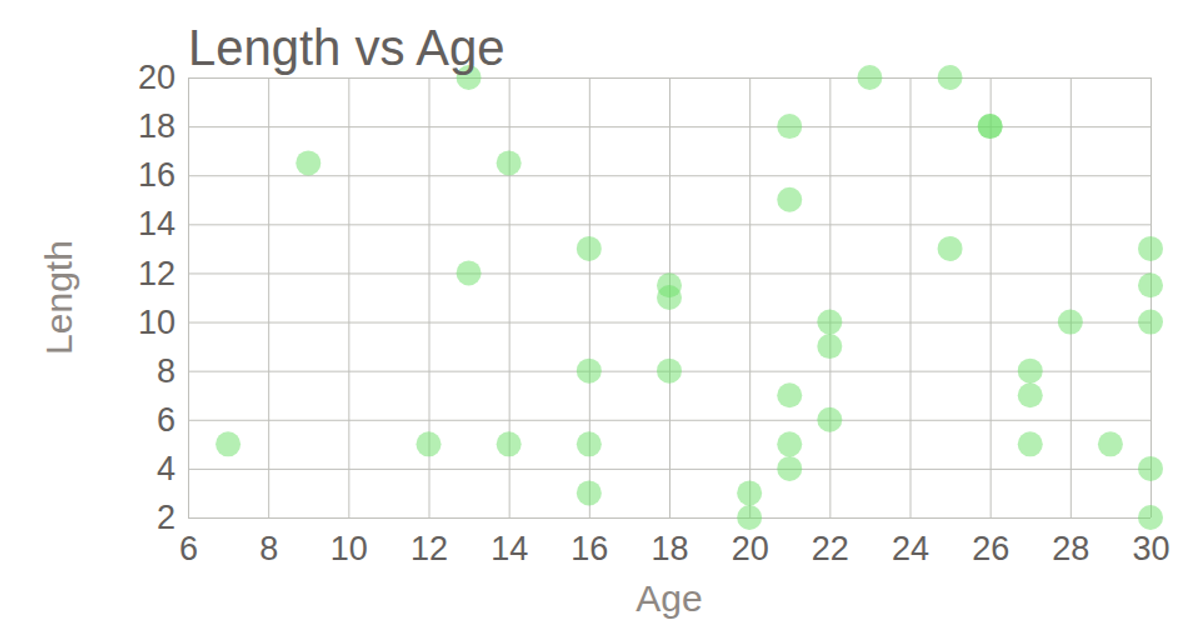
This scatter plot displays the relationship between length and age for a dataset of 39 items, with points distributed across a linear scale on both axes. The visualization positions circles based on their numeric values for each attribute, using D3 v5’s `scaleLinear`, `axisBottom`, and `axisLeft` to construct the coordinate system and gridlines. The code loads data from a remote CSV via `d3.csv`, parses numeric fields, and renders the chart as SVG within a React component, adding axis labels and a title to clarify the comparison.
AI-generated descriptionReact Starter code.
MIT Licensed




Comments
Sign in to join the discussion.