🌍 Public
Fork of activity7_question1
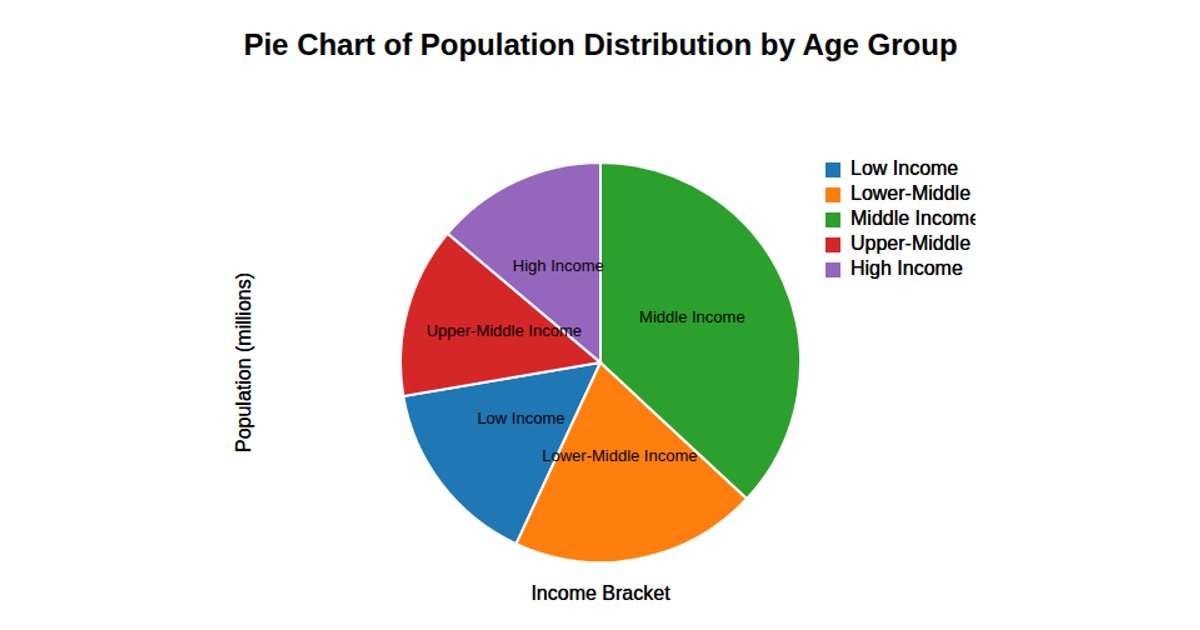
A pie chart displays the poverty percentage for the years 2000 through 2004, with each year’s value shown as a proportional slice and labeled directly on the chart. The visualization uses D3 v7 and renders to an SVG element. The code builds the chart with `d3.pie` to compute arc data and `d3.arc` for the path geometry, while `d3.scaleOrdinal` with `d3.schemeCategory10` assigns colors to years. A legend, added separately, lists each year and its numeric poverty percentage.
AI-generated descriptionMIT Licensed


Comments
Sign in to join the discussion.