🌍 Public
Fork of Vega-Lite API2026
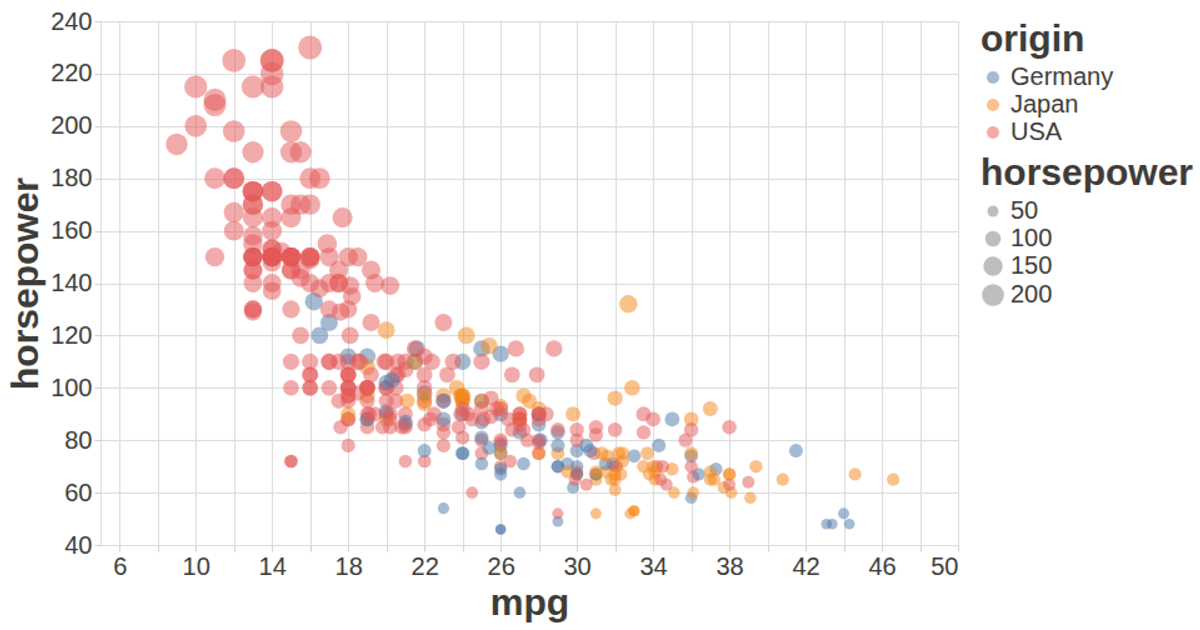
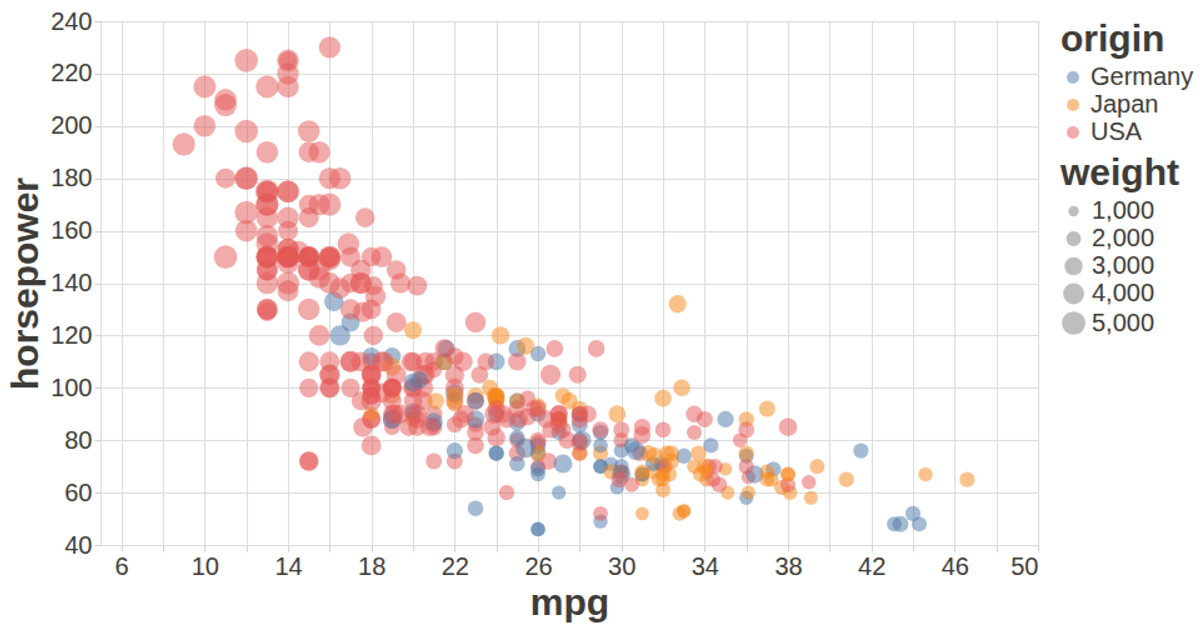
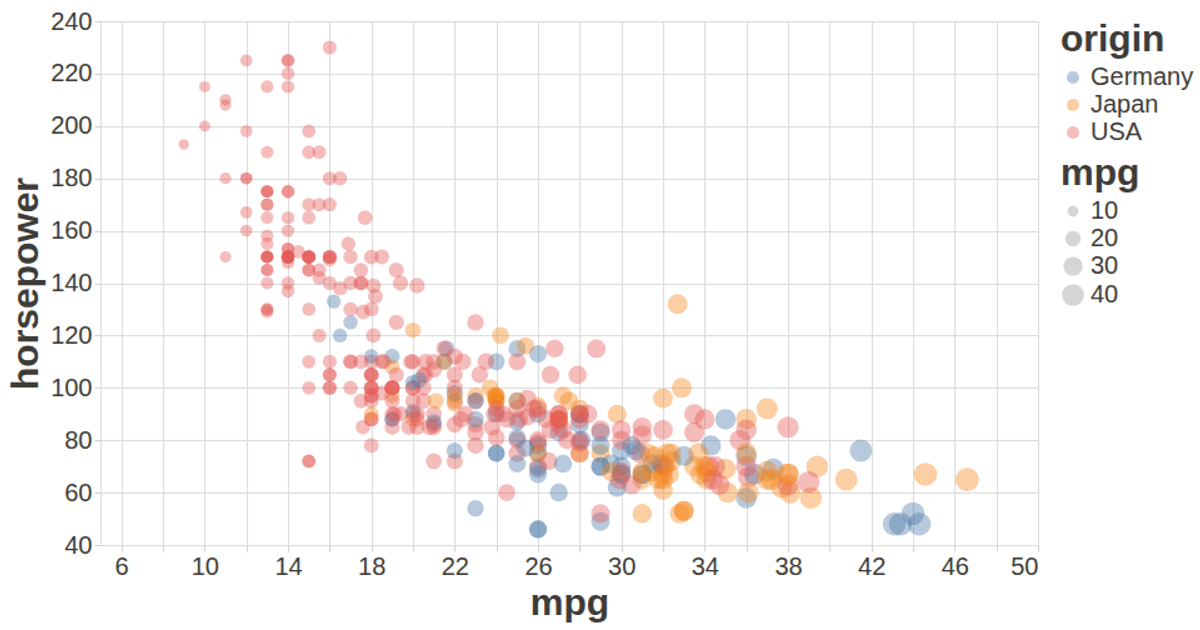
This example uses a scatter plot to visualize relationships in the auto-mpg dataset, showing miles per gallon against horsepower with points colored by origin and sized by weight. The visualization is built using the Vega-Lite API for declarative specification, with data loaded via d3.csv. The chart leverages vega-lite-api’s chained methods for encoding, and integrates vega-tooltip for interactive hover details. The rendering uses the Vega view with SVG output, configured with custom styling for axis labels and titles.
AI-generated descriptionMIT Licensed



Comments
Sign in to join the discussion.