🌍 Public
Final ICE6 submission
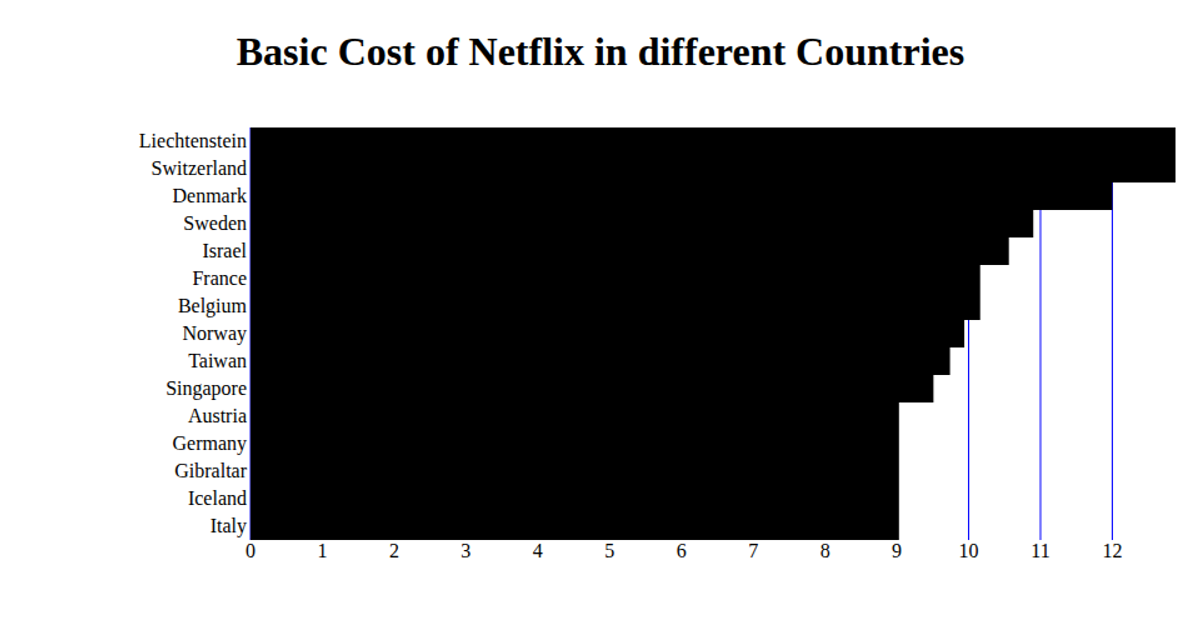
This example displays film sales data across countries in a horizontal bar chart, comparing monthly starter costs per zone. The visualization uses React with D3 v5 methods including `scaleBand`, `scaleLinear`, and `csv` to load and process data from a GitHub gist. Rendered as SVG, the chart shows red gridlines and labeled axes, with bars representing values for each category. The code imports `useState`, `useEffect`, and `useCallback` to manage asynchronous data loading and state within a functional React component.
AI-generated descriptionA whole smiley face
MIT Licensed




Comments
Sign in to join the discussion.