🌍 Public
Dinesh.Budha
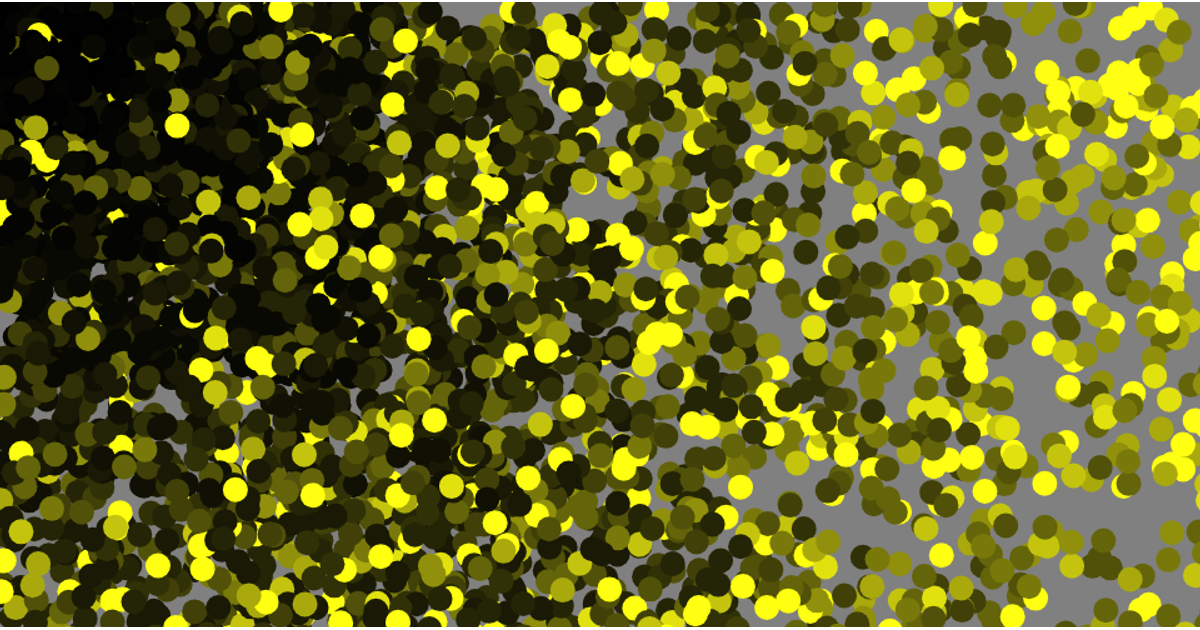
This example presents a dense scatter of small, multi-colored circles generated from a nested set of array mappings. The visualization relies on React and ReactDOM to render an SVG canvas, where each circle's position and fill color are determined by random calculations using `Math.random()`. The composition also incorporates a single, large, hand-drawn SVG path, outlined with a specific stroke, which is transformed and scaled to overlay the scattered points. The piece demonstrates how raw code can produce a complex, layered visual outcome.
AI-generated descriptionReact Starter code.
MIT Licensed




Comments
Sign in to join the discussion.