🌍 Public
Points on a map
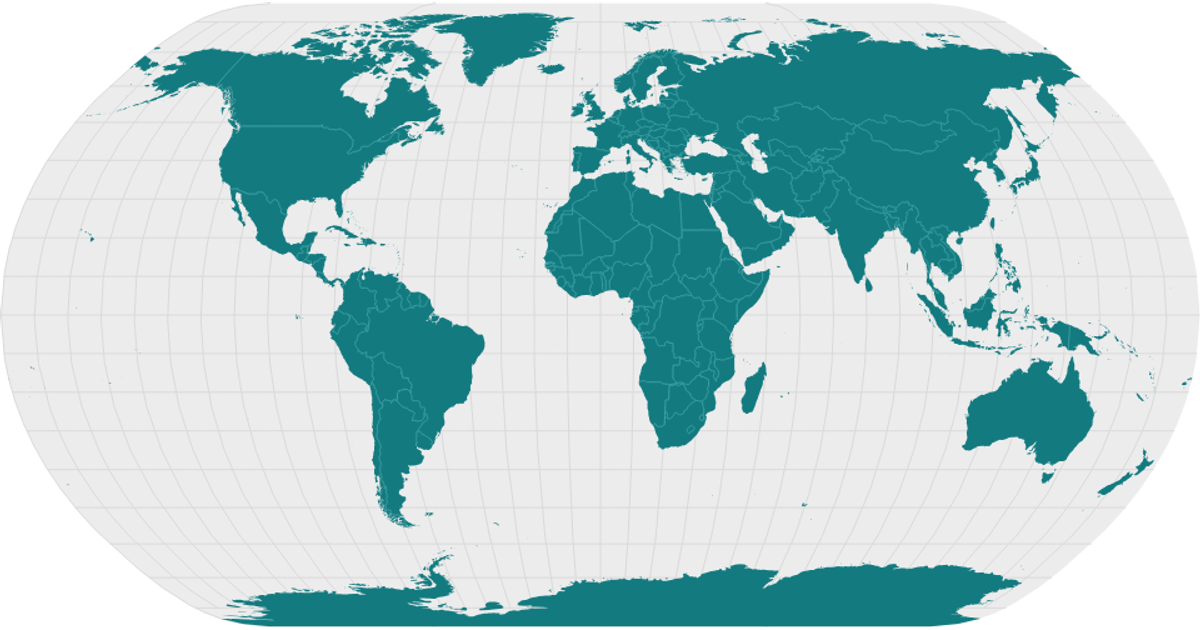
This example projects the world’s countries as SVG paths onto a Natural Earth projection using the `geoNaturalEarth1` projection and `geoPath` from D3 v7. It displays graticules and sphere outlines alongside landmasses, with a topological mesh of country borders drawn from the `world-atlas` dataset. The React app fetches TopoJSON, converts it to GeoJSON via `topojson.feature` and `topojson.mesh`, and styles the resulting shapes with CSS.
AI-generated descriptionMIT Licensed


Comments
Sign in to join the discussion.