🌍 Public
Missing Migrants Project Visualization
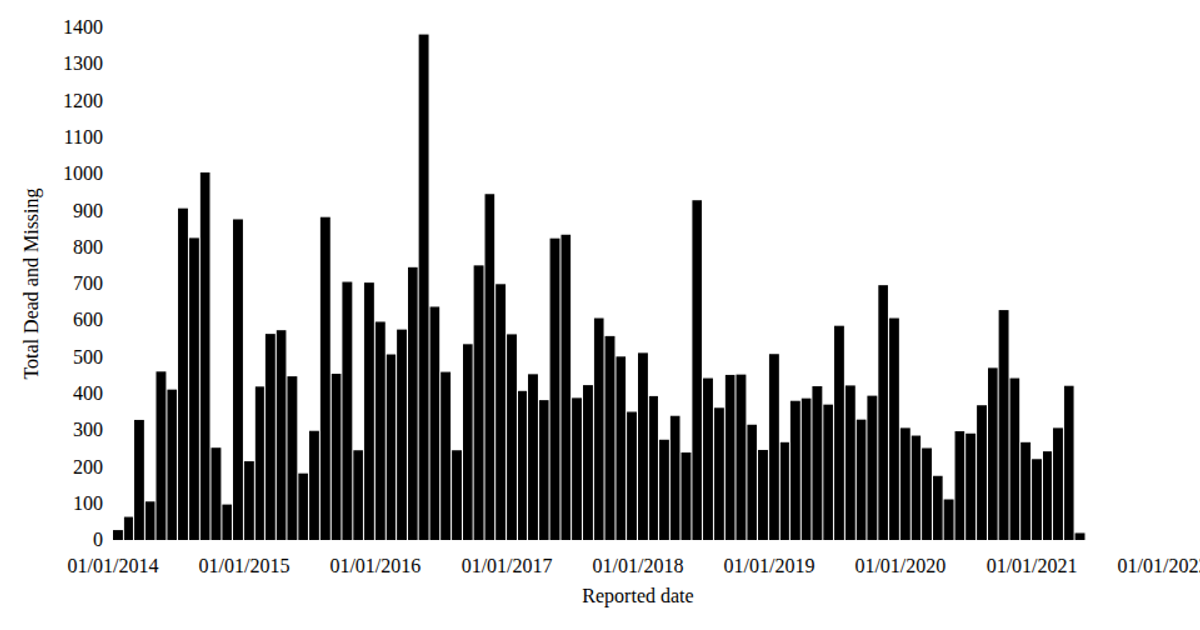
This visualization aggregates monthly totals of dead and missing migrants from the Missing Migrants Project dataset, using a bar chart to show the cumulative count over time. React components render SVG rectangles via a histogram binning function, with `d3.timeMonths` defining the temporal bins and `d3.scaleTime` mapping the reported dates to horizontal positions. The y-axis uses `d3.scaleLinear` to encode the summed values, while custom `AxisBottom` and `AxisLeft` components generate tick marks. The chart employs Zen Loop typography and teal-colored bars to present the data from the CSV file.
AI-generated descriptionStylized Line Chart Working With Time
MIT Licensed



Comments
Sign in to join the discussion.