🌍 Public
Let's make a map with D3.js!
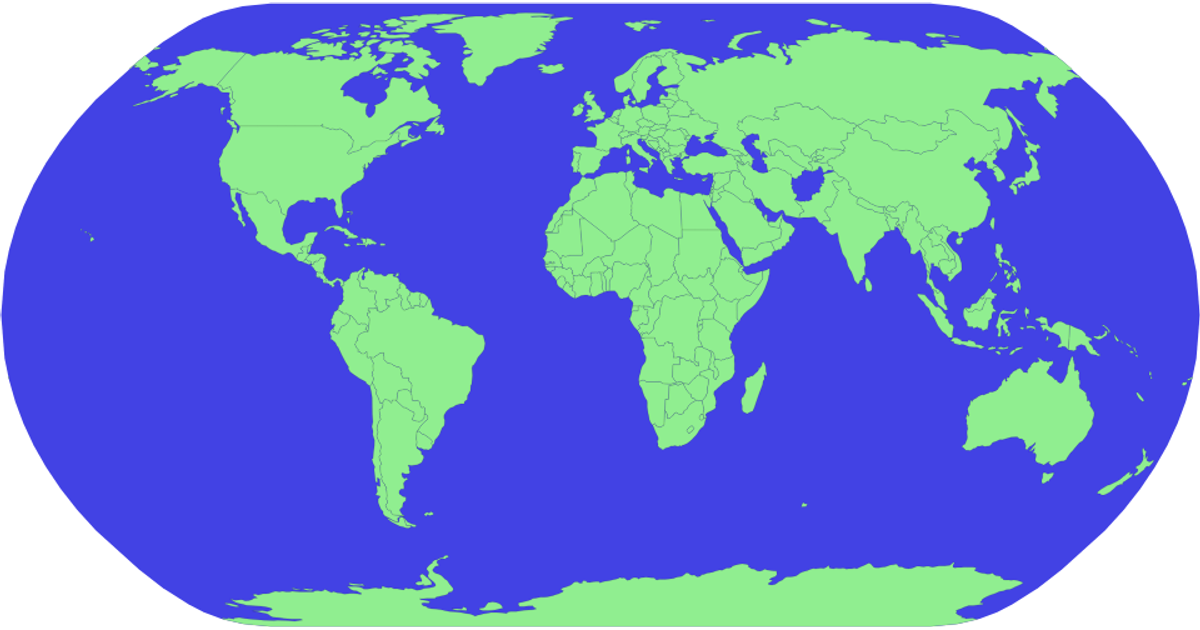
This example displays a world map with country boundaries and a graticule overlay, rendered as SVG using D3.js v5. It shows countries as light green polygons with subtle black strokes against a blue sphere background. The code uses `d3.geoNaturalEarth1()` for projection, `d3.geoPath()` for path generation, and TopoJSON’s `feature` method to convert World Atlas TopoJSON data (from unpkg) into GeoJSON. A graticule is drawn with `geoGraticule`, and the sphere outline is generated via `pathGenerator({type: 'Sphere'})`.
AI-generated descriptionA world map showing country boundaries from World Atlas TopoJSON.
MIT Licensed




Comments
Sign in to join the discussion.