🌍 Public
Fork of ICE-6: Rendering Marks and Channels with React & D3
SSaiipriiya
Last edited Mar 6, 2023
Created on Mar 6, 2023
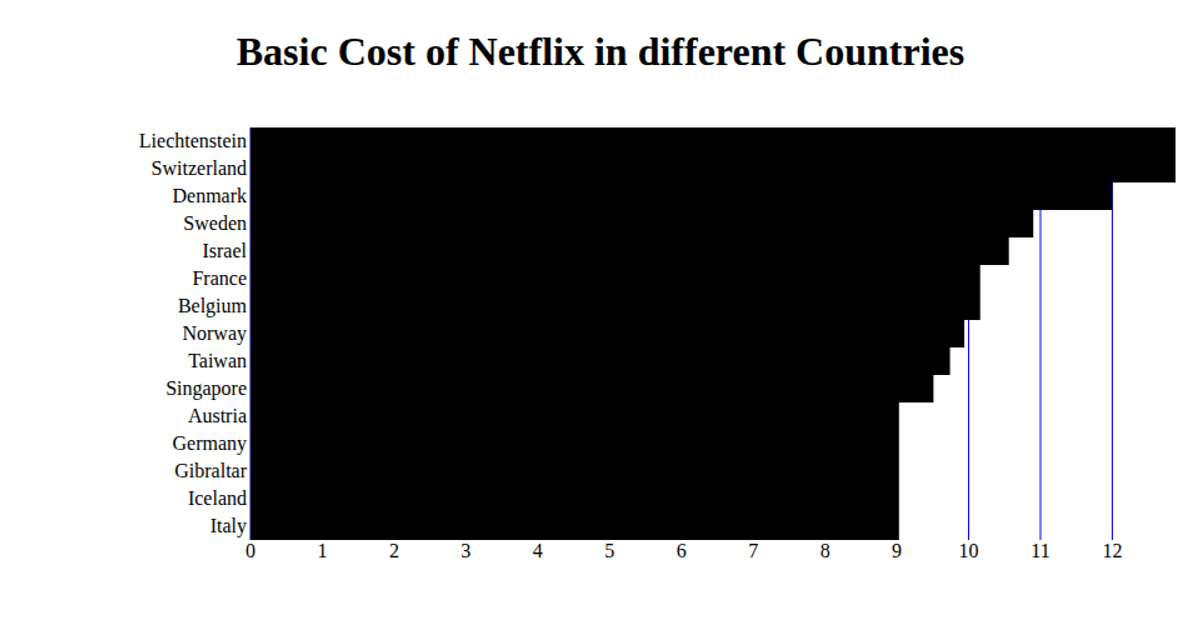
This example shows the basic cost of Netflix subscriptions in different countries using a bar chart rendered on a Canvas. The visualization is built with React and D3 (v5) within an HTML page that loads both libraries via CDN. The chart.js API is used to create the bar chart, mapping sales data values to bar heights and month labels to the x-axis, while the D3 library handles additional rendering. The code defines a dataset of five monthly sales figures and displays them as a single series with blue borders.
AI-generated descriptionA bare minimum HTML page.
MIT Licensed






Comments
Sign in to join the discussion.