🌍 Public
Fork of Sarawak Visualize By Kevin
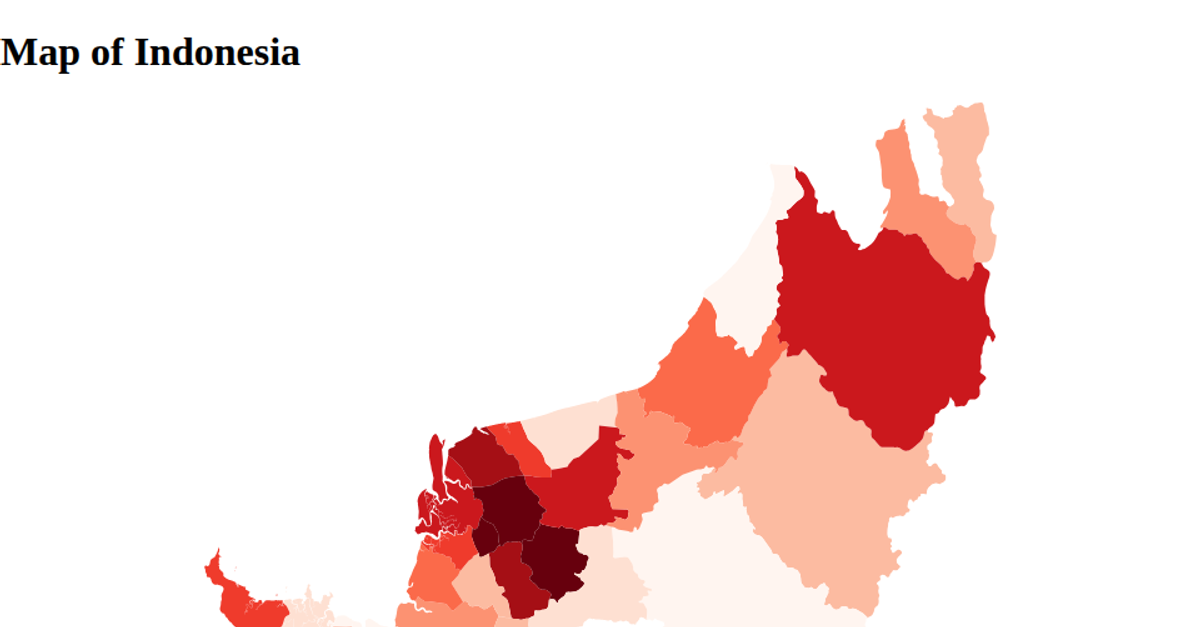
This choropleth map of Sarawak uses a natural Earth projection to render the state’s districts, with each region filled using a blue sequential color scale. The visualization loads GeoJSON district boundaries via `d3.json` and `topojson.feature`, then draws SVG paths with `d3.geoPath`. State selection filters data to Sarawak only. Built with React and D3 v5, the map adapts its projection to the available width and height.
AI-generated descriptionMIT Licensed







Comments
Sign in to join the discussion.