🌍 Public
Choropleth Map with Interactive Filtering
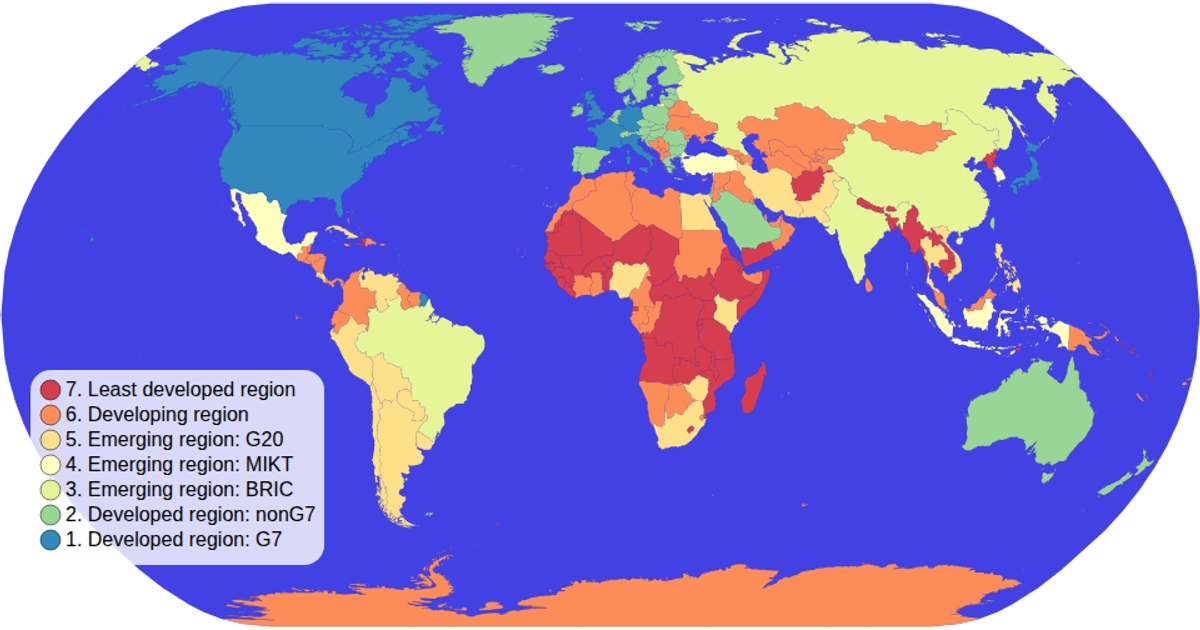
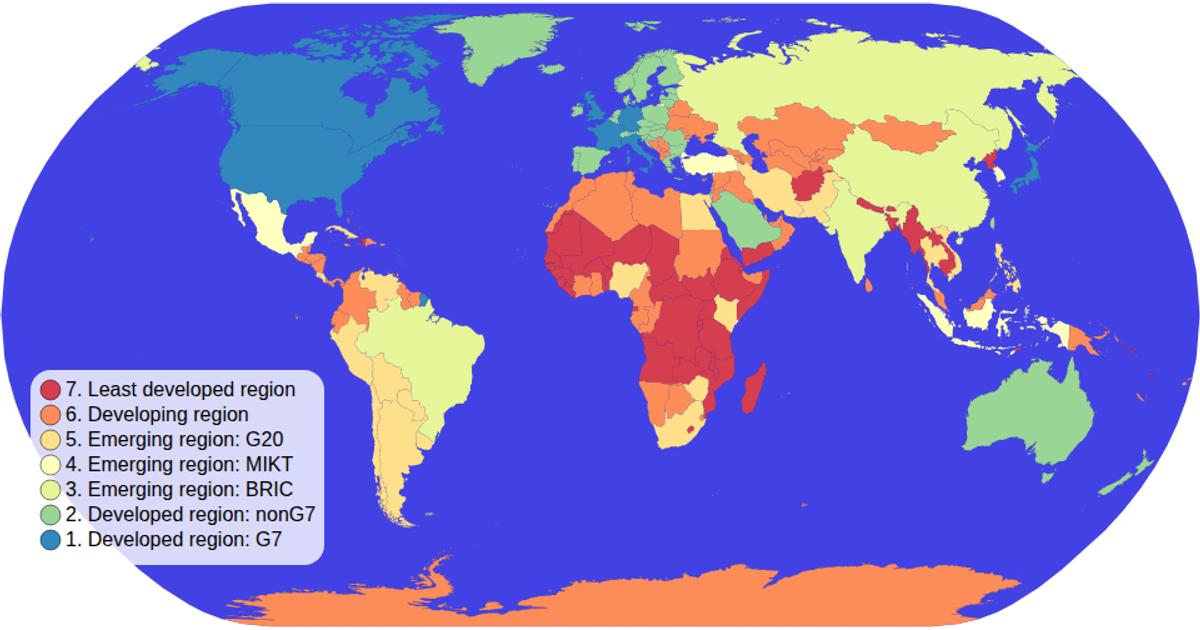
A choropleth map of world countries colored by economic classification, rendered with d3.geoPath and the geoNaturalEarth1 projection. Users click legend swatches to filter the map, dimming non-matching countries and highlighting the selected category, which also reduces the sphere's opacity. The visualization uses d3.scaleOrdinal with a spectral scheme, loads data via d3.tsv and d3.json from the world-atlas package, and implements pan/zoom through d3.zoom.
AI-generated descriptionMIT Licensed




Comments
Sign in to join the discussion.