🌍 Public
Assignment_2ques2_Pvs
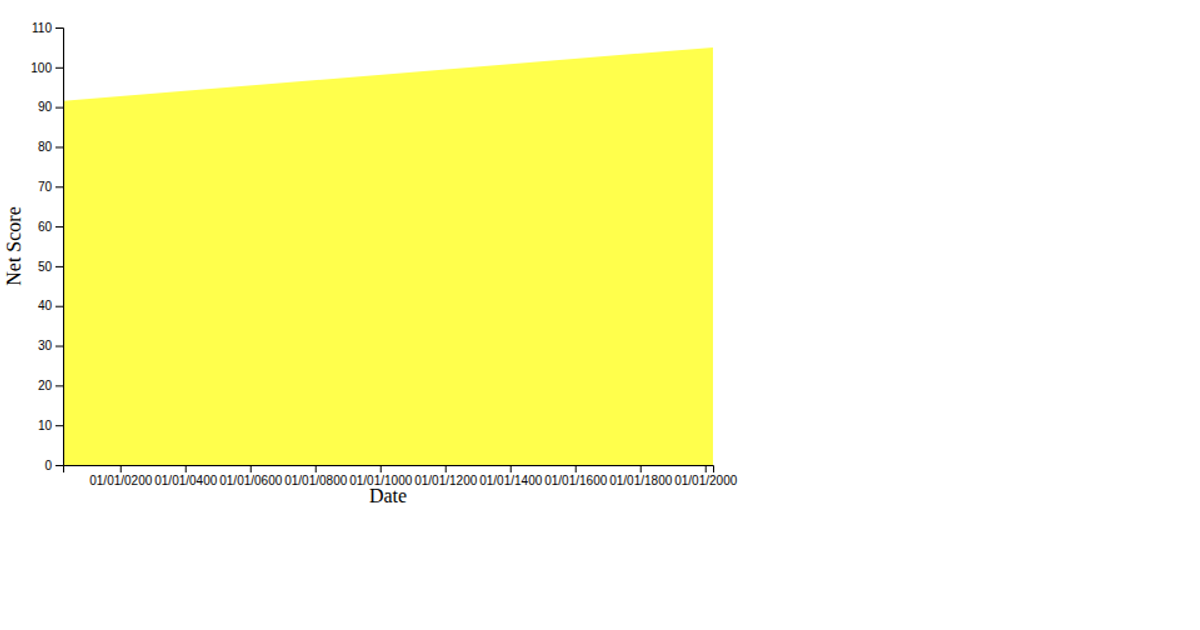
Two semi-transparent area charts show Team A and Team B performance scores over time in 2025, with overlapping regions differentiating the two teams’ progress. Dots at each data point provide interactive tooltips displaying the timestamp and score on hover. The visualization uses D3.js v7’s `d3.area` generator, `d3.scaleTime`, `d3.scaleLinear`, and SVG `circle` elements, loading timestamped CSV data from a GitHub Gist. D3 transitions animate tooltip opacity, and CSS styling controls legend, title, and axis labels.
AI-generated descriptionMIT Licensed



Comments
Sign in to join the discussion.