🌍 Public
Fork of Fork of Fork of Fork of Car Reports
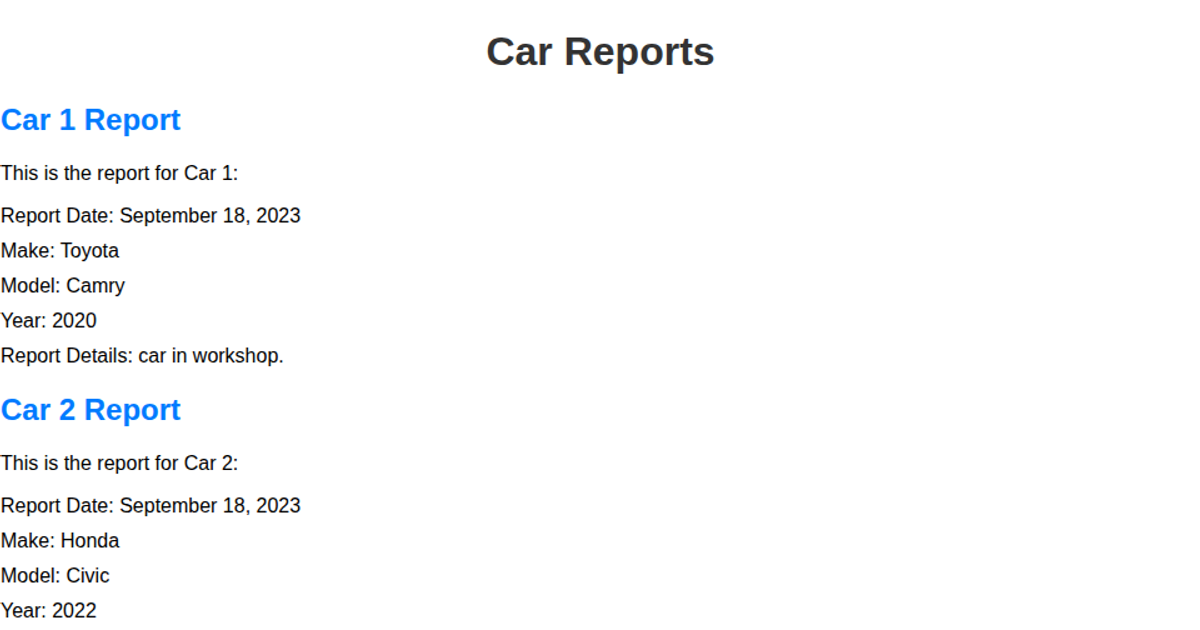
This example displays a static web page of car service reports for two vehicles, listing details such as make, model, and condition. It pairs this textual data with two inline SVG graphics, the first featuring a blue banner background with a "Car Reports" title, and the second a composition of colored circles and rectangles, many with strokes and dash patterns. The code uses standard HTML, CSS, and JavaScript, with the SVG drawn directly within the index file.
AI-generated descriptionA bare minimum HTML page demonstrating use of CSS and JavaScript.
See also React Starter.
MIT Licensed




Comments
Sign in to join the discussion.