🌍 Public
faltu fork
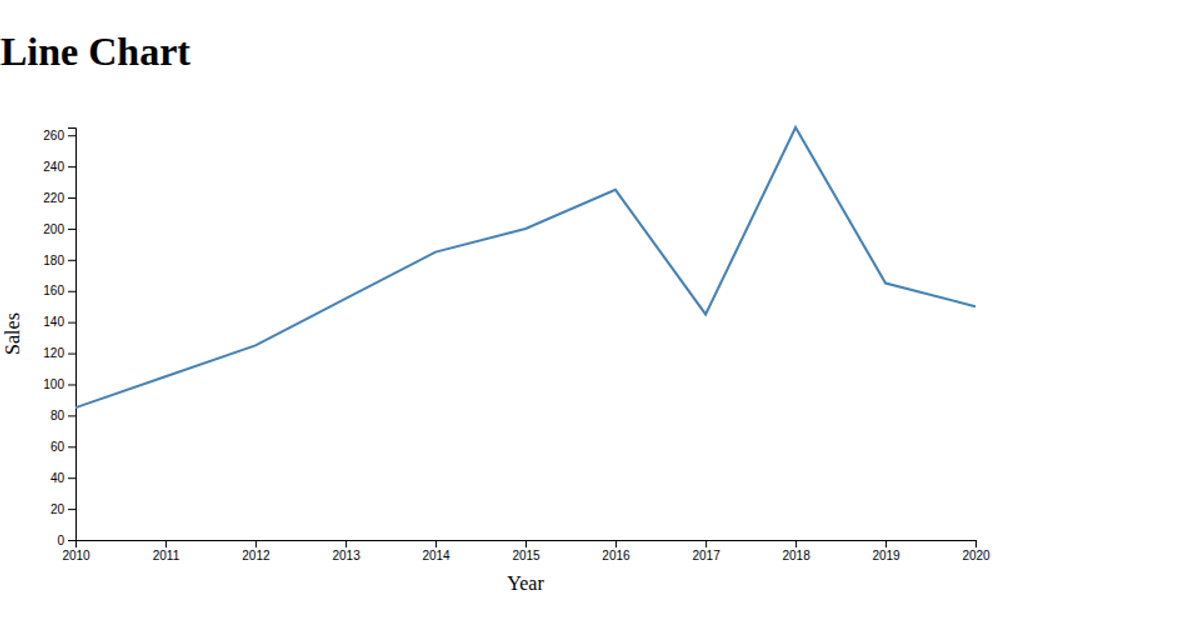
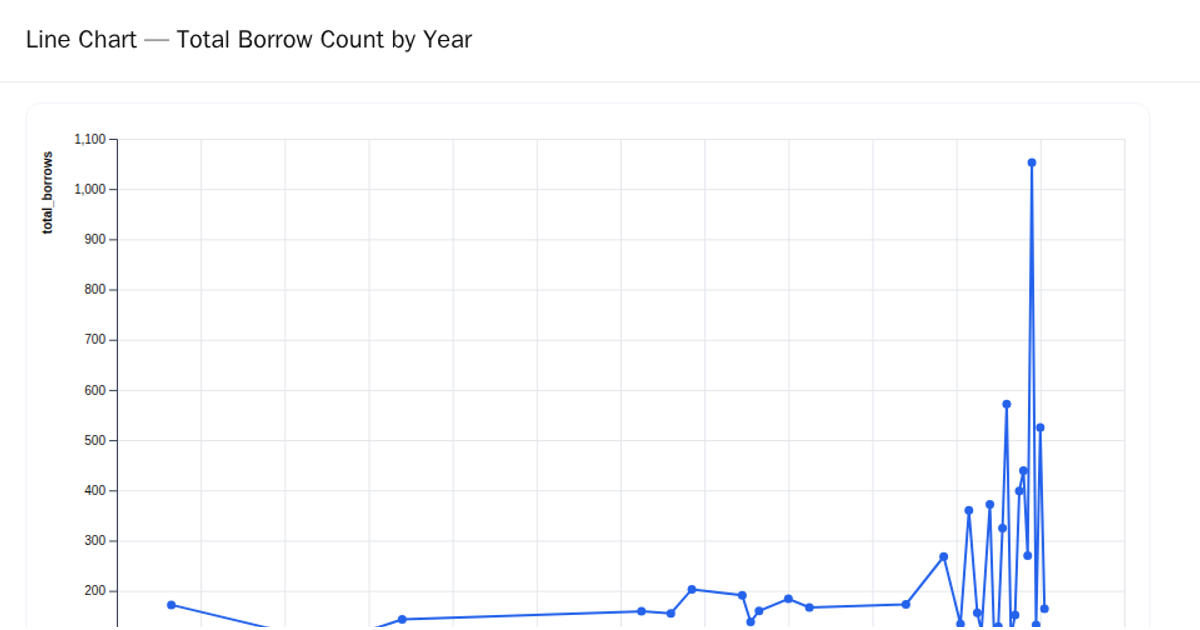
This example displays a line chart showing the total pills counted per year, using a dataset loaded from a remote CSV. The visualization employs D3 v5’s `scalePoint` and `scaleLinear` to map years and values, while an SVG path is generated with `line()` and `curveBasis` for the curve. Axes are added via `axisLeft` and `axisBottom`, with a black stroke styled through the `.line-path` class. The chart is rendered entirely in SVG within a fixed 460x400 canvas.
AI-generated descriptionMIT Licensed





Comments
Sign in to join the discussion.