🌍 Public
Powers Donut Graph
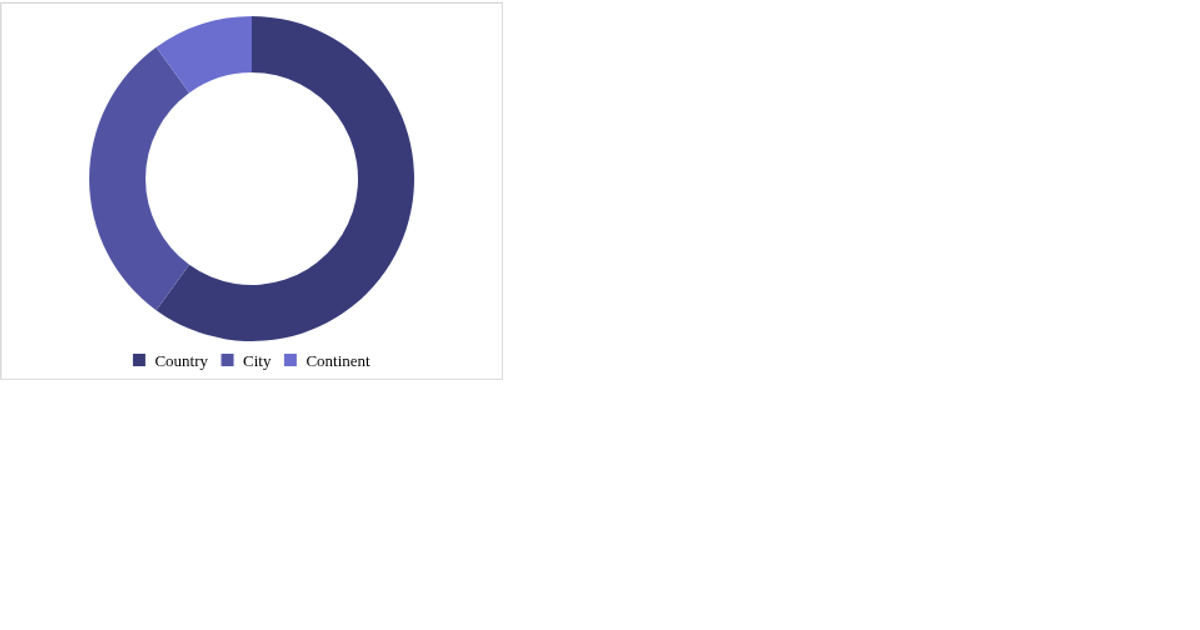
This donut chart displays the proportion of Marvel characters categorized as good, bad, or neutral based on their alignment. The code loads character and power column data via `d3.csv`, counts alignments, and renders an SVG donut using `d3.pie` and `d3.arc`. A dropdown menu populated from `columns.csv` lets users select a categorical power, though the selection currently only logs to the console. Hovering an arc turns it black.
AI-generated descriptionPie chart to show the breakdown of sides for a specific categorical power.
Data from: https://gist.github.com/LeahMitchell/8ad46fbcac8d7420bcd5b97b1a245f43
MIT Licensed



Comments
Sign in to join the discussion.