🌍 Public
Exercise
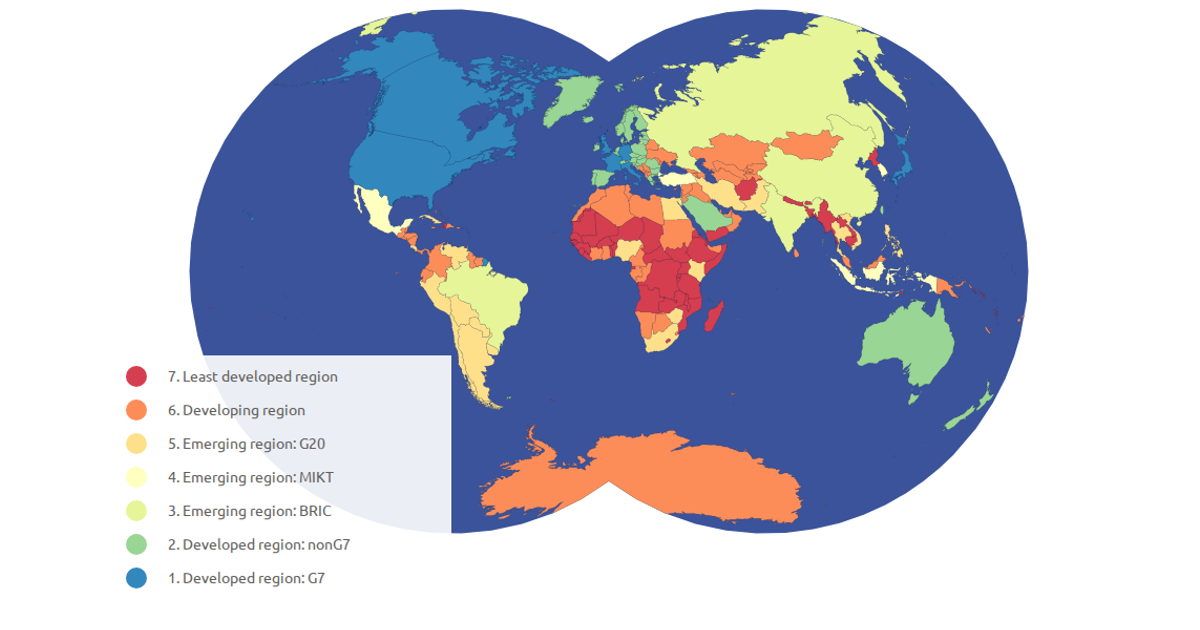
This visualization shows a choropleth map of countries colored by their economy type, with an interactive legend that filters and highlights selected categories. The map uses a natural Earth projection with d3.geoPath, while the view supports pan and zoom via d3.zoom. Data comes from world-atlas TopoJSON with a TSV mapping country codes. Colors are assigned through d3.scaleOrdinal with the Spectral scheme, and clicking legend items toggles dimming of non-selected countries.
AI-generated descriptionMIT Licensed




Comments
Sign in to join the discussion.